
Editing Monitored Page Settings
You can change the options you have set for a monitored page. You can change the page name or any of the page monitoring options. You can also change the page URL. If you change the URL to an unrelated page, the historical data is meaningless and it is automatically deleted. You should only change the URL if the page itself has a changed URL.
|
|
NOTE: If you need to replace a page completely, you should remove the page and then add the new page. |

To edit the settings for a monitored page:
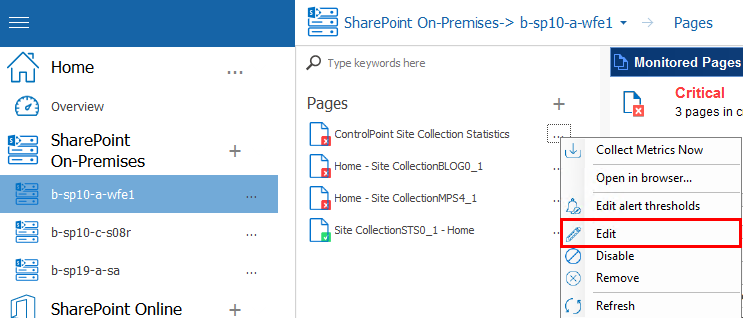
1In the Management Console, select the farm that contains the monitored page you want to open.
2Select the farm name above the overview pane, and select Pages from the drop down panel.

3In the pages column, select the (...) next to the page you want to view, and click Edit from the dropdown menu.
4In the Edit Monitored Page dialog box, make the necessary changes.
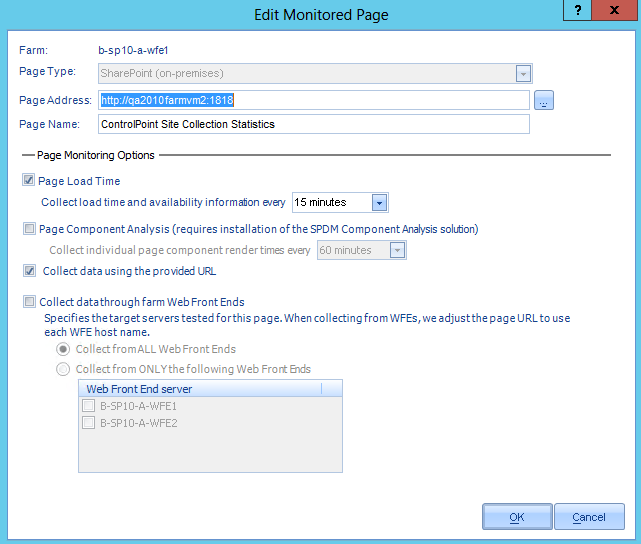
5In the Page Monitoring Options area, specify the page options.
6Click OK.
Removing a Monitored Page
You can remove a monitored page when you no longer need to monitor it.
To remove a monitored page:
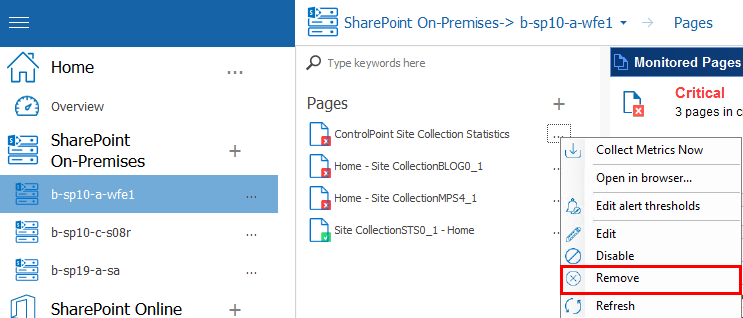
1In the Management Console, select the farm that contains the monitored page you want to open.
2Select the farm name above the overview pane, and select Pages from the drop down panel.
3In the pages column, select the (...) next to the page you want to view, and click Edit from the dropdown menu.
4You will be prompted to confirm the action before continuing.
Viewing the Health of a Farm
Metalogix Diagnostic Manager includes the following two features that enable you to check the configuration and health of a monitored SharePoint 2010, 2013, or 2016 farm:
·The Health Analyzer lets you view any issues with your SharePoint farm performance as of the last Collection Service run. Metalogix Diagnostic Manager compares your configuration with the set of best practices checked by SharePoint Health Analyzer. The Issue Details pane of this view allows you to view the details of an issue found by the SharePoint Health Analyzer.
|
|
NOTE: The Metalogix Diagnostic Manager Health Analyzer feature is not available for SharePoint 2007 farms. |
If your SharePoint Credentials let you access the Central Administration page for the farm, you can access the Health Analyzer directly. You can click View Health Analyzer problems and solutions to open the SharePoint Central Administration problems and solutions page. You can click View Health Analyzer rules to open the SharePoint Central Administration Health Analyzer Rule Definitions page.
·The Farm Configuration and Health Checker, sends a request to the Collection Server to immediately update farm configuration and Health Analyzer data.
Reviewing the SharePoint Health Analyzer Content for the Farm
You can use the Metalogix Diagnostic Manager Management Console to review content from the SharePoint Central Administration Health Analyzer pages, including details for the issues the Health Analyzer finds. If your SharePoint credentials allow you to do so, you can open the Health Analyzer problems and solutions page or the Health Analyzer rules page from the Management Console.
To review the Health Analyzer content for the farm
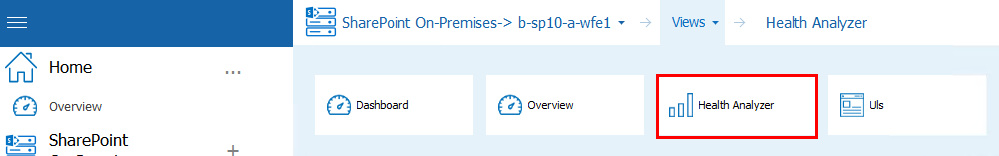
1In the Management Console, select the farm whose Health Analyzer you would like to view.
2Select the farm name above the overview pane, and select Views from the drop down panel.

3Select Views, this will open another drop down panel, select Health Analyzer.
To view more detailed information about a Health Analyzer Issue
Double-click the issue to display the Health Analyzer Issues dialog.
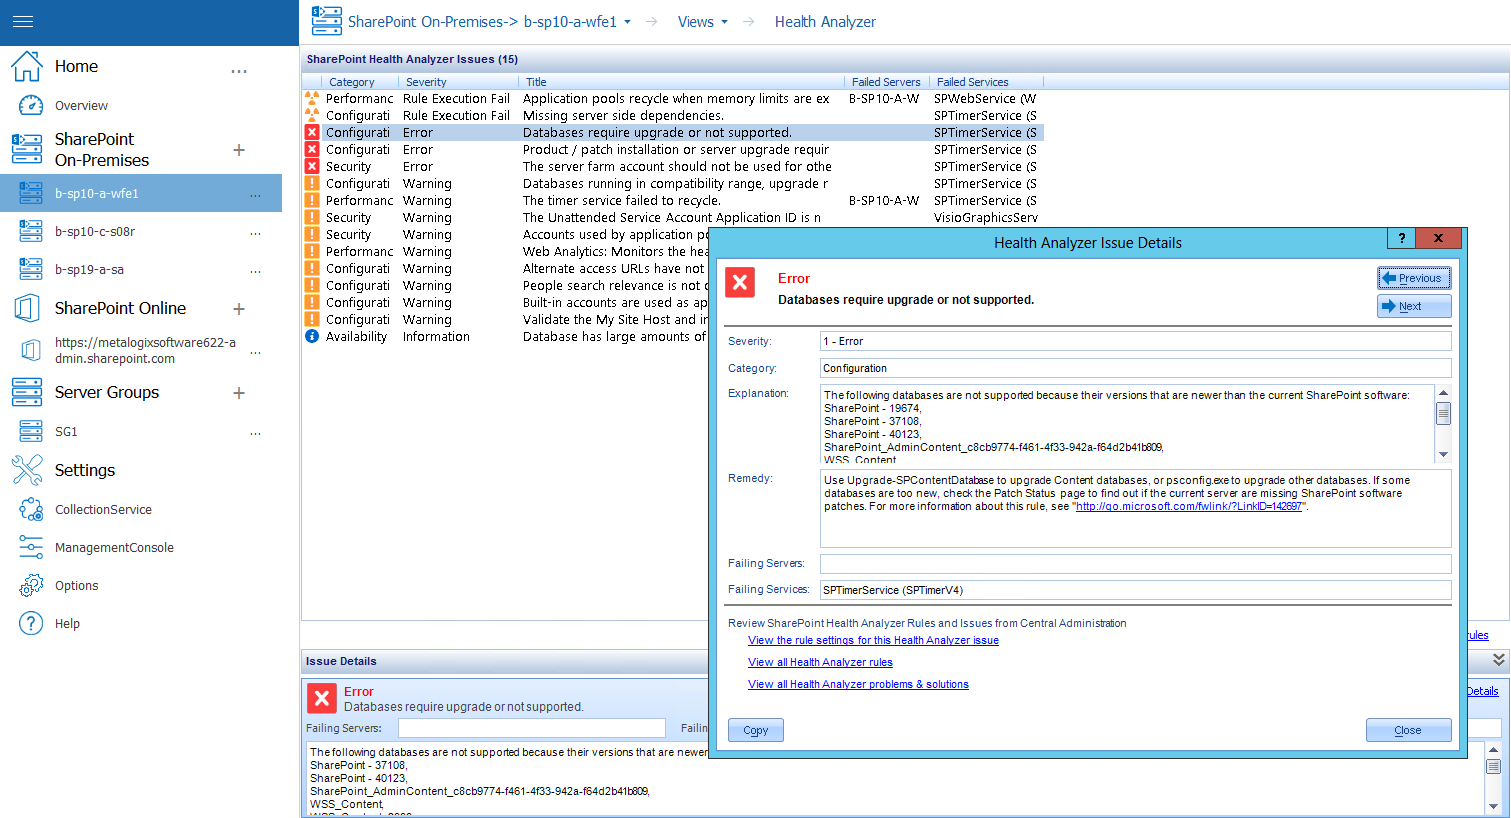
Health Analyzer Issue Details
You can view additional details for the issues discovered by the SharePoint Health Analyzer, view problems and solutions, and view the Health Analyzer rules using Metalogix Diagnostic Manager. The Health Analyzer measures your current configuration against recommended best practices.
While the list view on the Health Analyzer page includes the issue severity, category or issue type, severity, title, and the associated failed servers and services, the Health Analyzer Issue Details dialog box includes the following items:
·Expanded explanation of the issue
·Remedy for the issue
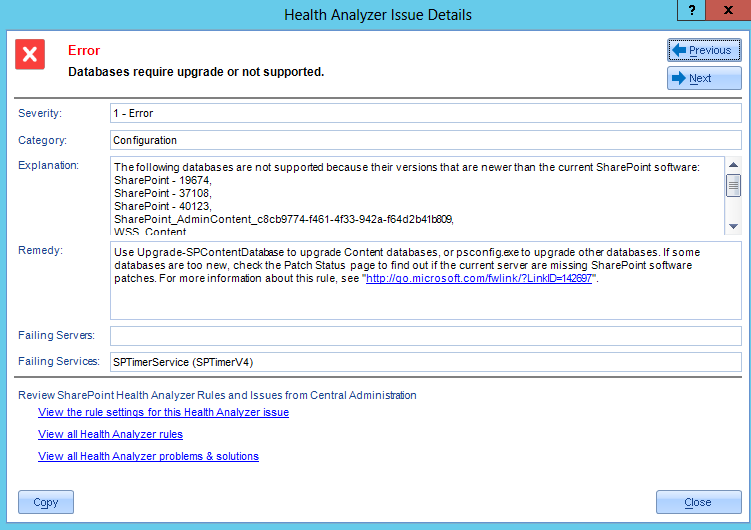
Click Next or Previous to scroll through the details for all of your issues.
The following links in the Health Analyzer Issue Details dialog take you to other views within SharePoint:
·View the rule settings for this Health Analyzer issue. Accesses the specific Health Analyzer Rule Definitions page on the Central Administration site for the selected rule.
·View all Health Analyzer rules. Accesses the Health Analyzer Rule Definitions page for all rules on the Central Administration site.
·View all Health Analyzer problems & solutions. Accesses the Review problems and solutions page for all reports on the Central Administration site.
To copy all of the issue details to your clipboard for additional use:
Click Copy.