Viewing the Server Dashboard
To view the Server Dashboard
1In the Management Console select the farm or server group that contains the server dashboard you want to view. Select its name above the viewing pane, and select Servers.

2Double click the name of the server you want to view, this will bring up the Overview Dashboard.
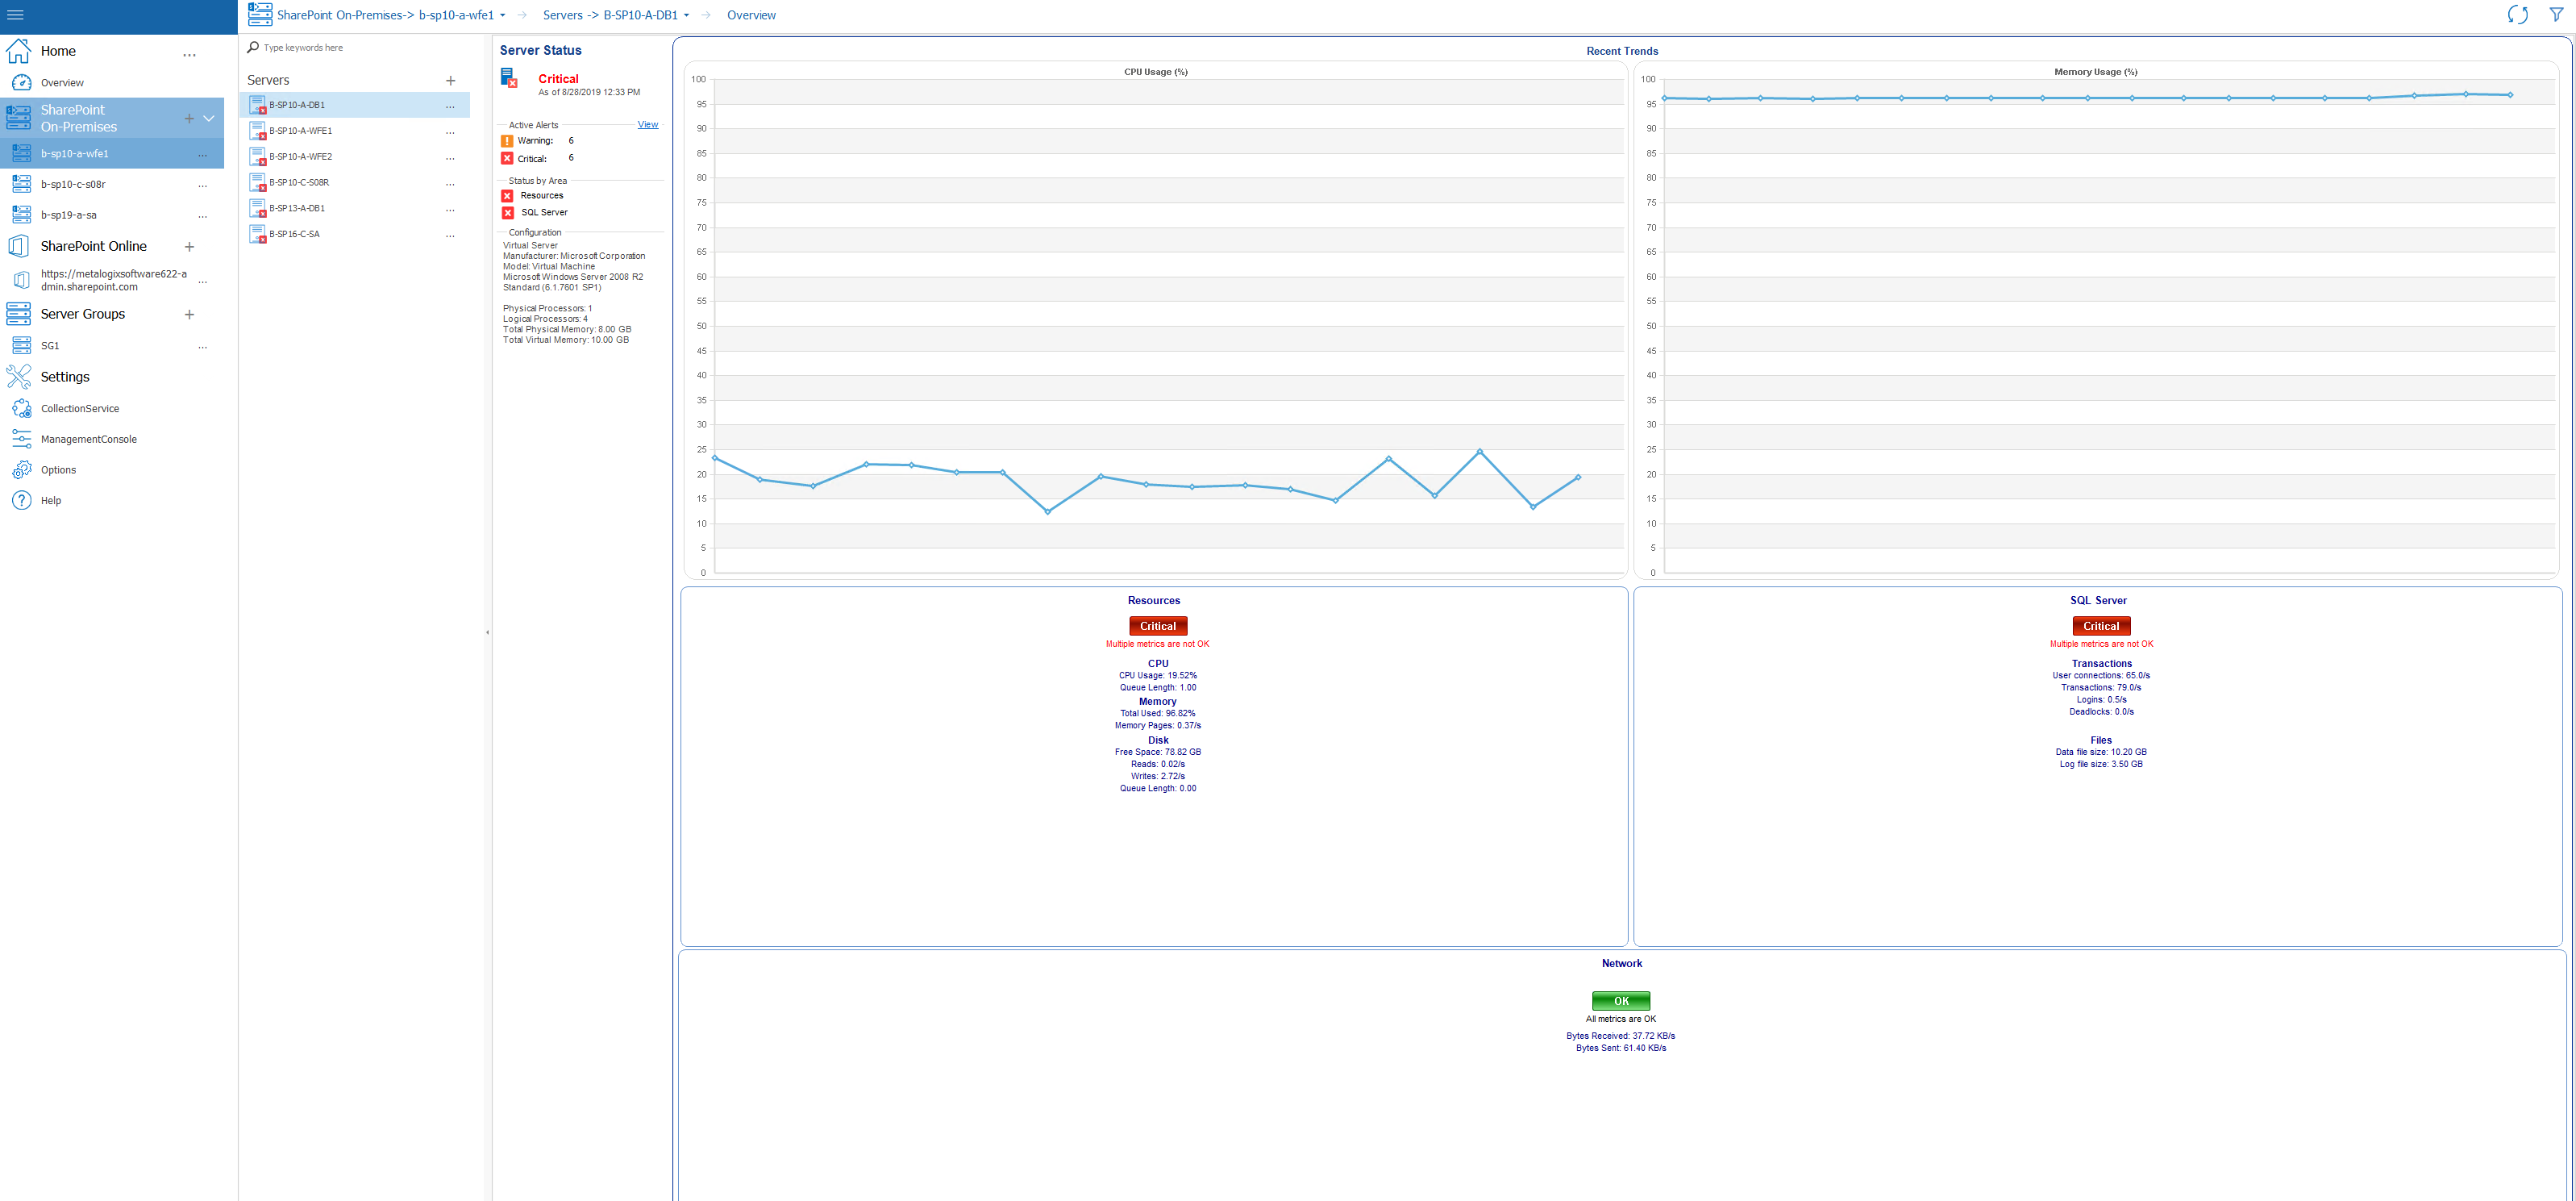
Server Component Status Information
When you view the Server Dashboard, the Management Console lists the components that make up the selected server. The components that appear vary, depending on the services on the server that you select. Depending on the selected server, some or all of the following items appear:
|
Information |
Description |
|---|---|
|
CPU Usage (%) |
A graph of the CPU usage. |
|
Memory Usage (%) |
A graph of the memory utilization on the server. |
|
ASP App Requests |
A graph of the ASP App Requests for the server. This graph only appears if the server hosts IIS components. |
|
Resources |
Lists information about the CPU, memory, and disk space metrics on the selected server. Disk metrics include all mounted disks and mount points. |
|
SharePoint |
In the case of a SharePoint farm, lists information about the SharePoint server role. If the server hosts any monitored pages, this includes information about the Monitored Pages. |
|
Network/IIS Web Services |
The name of this item varies. If the selected server hosts IIS, the item is Network/IIS/Web Services. If the selected server does not host IIS, the item name is Network. The item summarizes the network and IIS metrics. |
Each item lists relevant metrics and includes one or more status buttons. The status buttons roll up multiple metrics into a single status for rapid review.
You can click any metric or any status button for more details.
When you click a metric, you can review information about the metric. You can also link to the metric details and edit the alert threshold of the selected metric for the selected server.
When you click a status button, you can review the metric or metrics that make up the status. You can use the dialog box that appears to view the metric details or to edit the metric alert threshold.
The recent trend graphics show the previous two hours of performance data. To refresh these graphics the dashboard must be refreshed via the Management Console Preferences dialog.
Viewing Server Resource Graphs
The Resources tab of the Server view lets you review the CPU, memory, disk space, and network status of the selected server. The data appears in graphical format, letting you easily review the status of the server and see patterns in your server behavior. Disk metrics include all mounted disks and mount points.
You can also view the status and properties of all of the Windows Services on the server as well as start and stop these Services.
When you select the Resources tab, you can select the amount of time represented by each graph. You can also choose to display current data or historical data from a time that you specify. When the Management Console displays the graph, it averages the data in the graph. The time period used for the average depends on the duration that the graph represents.
When data is collected for the server
The Metalogix Diagnostic Manager Collection Service retrieves data from a server on a schedule that you specify in the Collection Service Options dialog. By default, the Collection Service retrieves this data every six minutes.
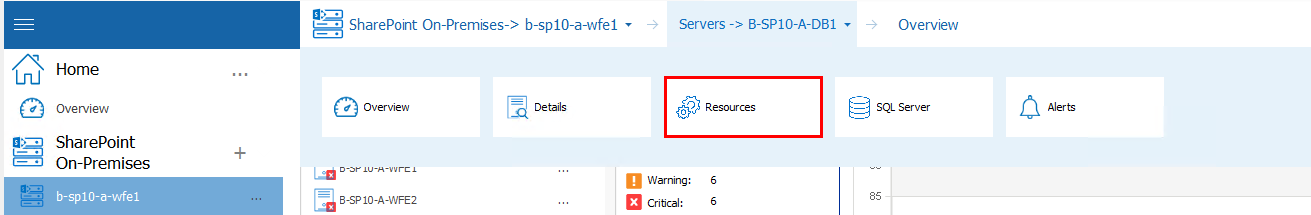
To view Server Resource graphs:
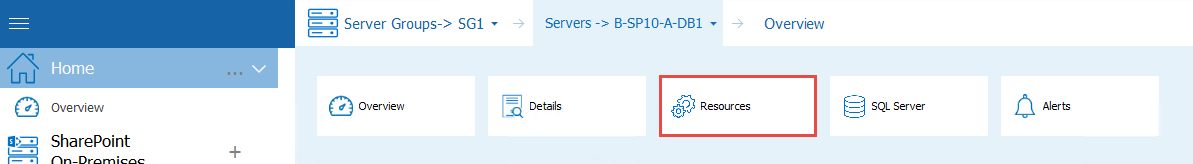
Select the server so that it is displayed in the overview pane. Select its name, above the overview pane, and select Resources from the dropdown panel.
Available Resource Graphs:
Selecting Resources allows you to choose the following resource views from the drop down panel.
·Overview: A high-level overview of the most important server components.
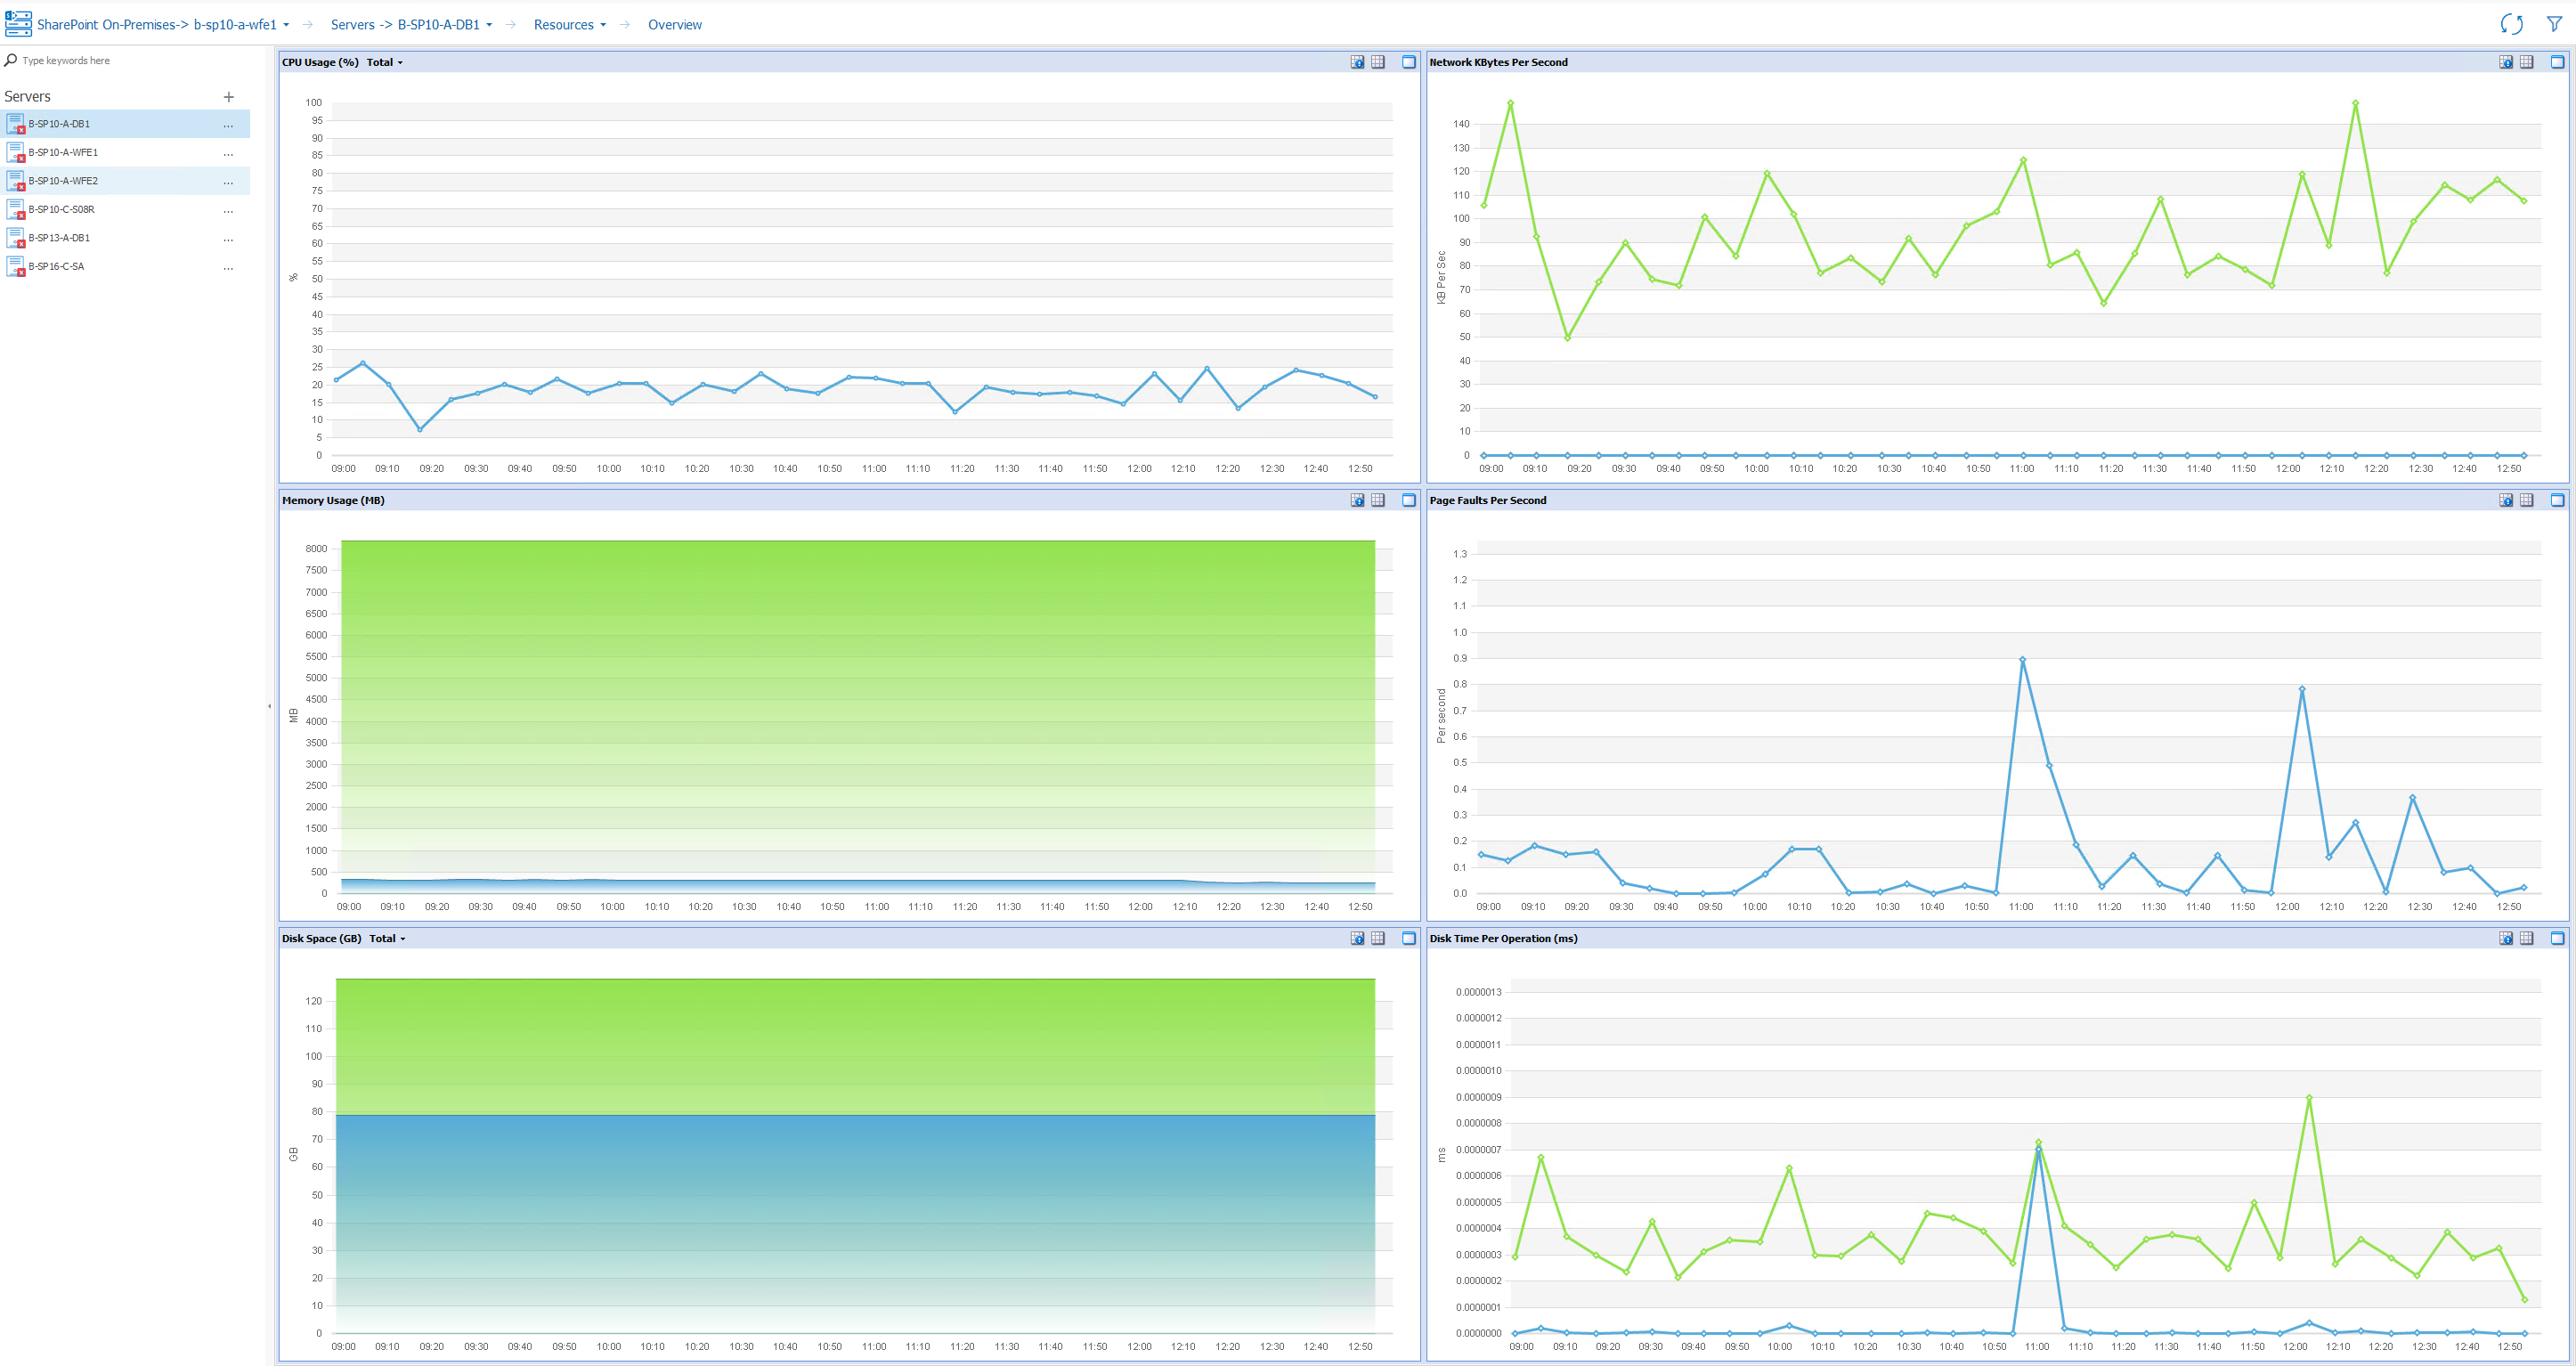
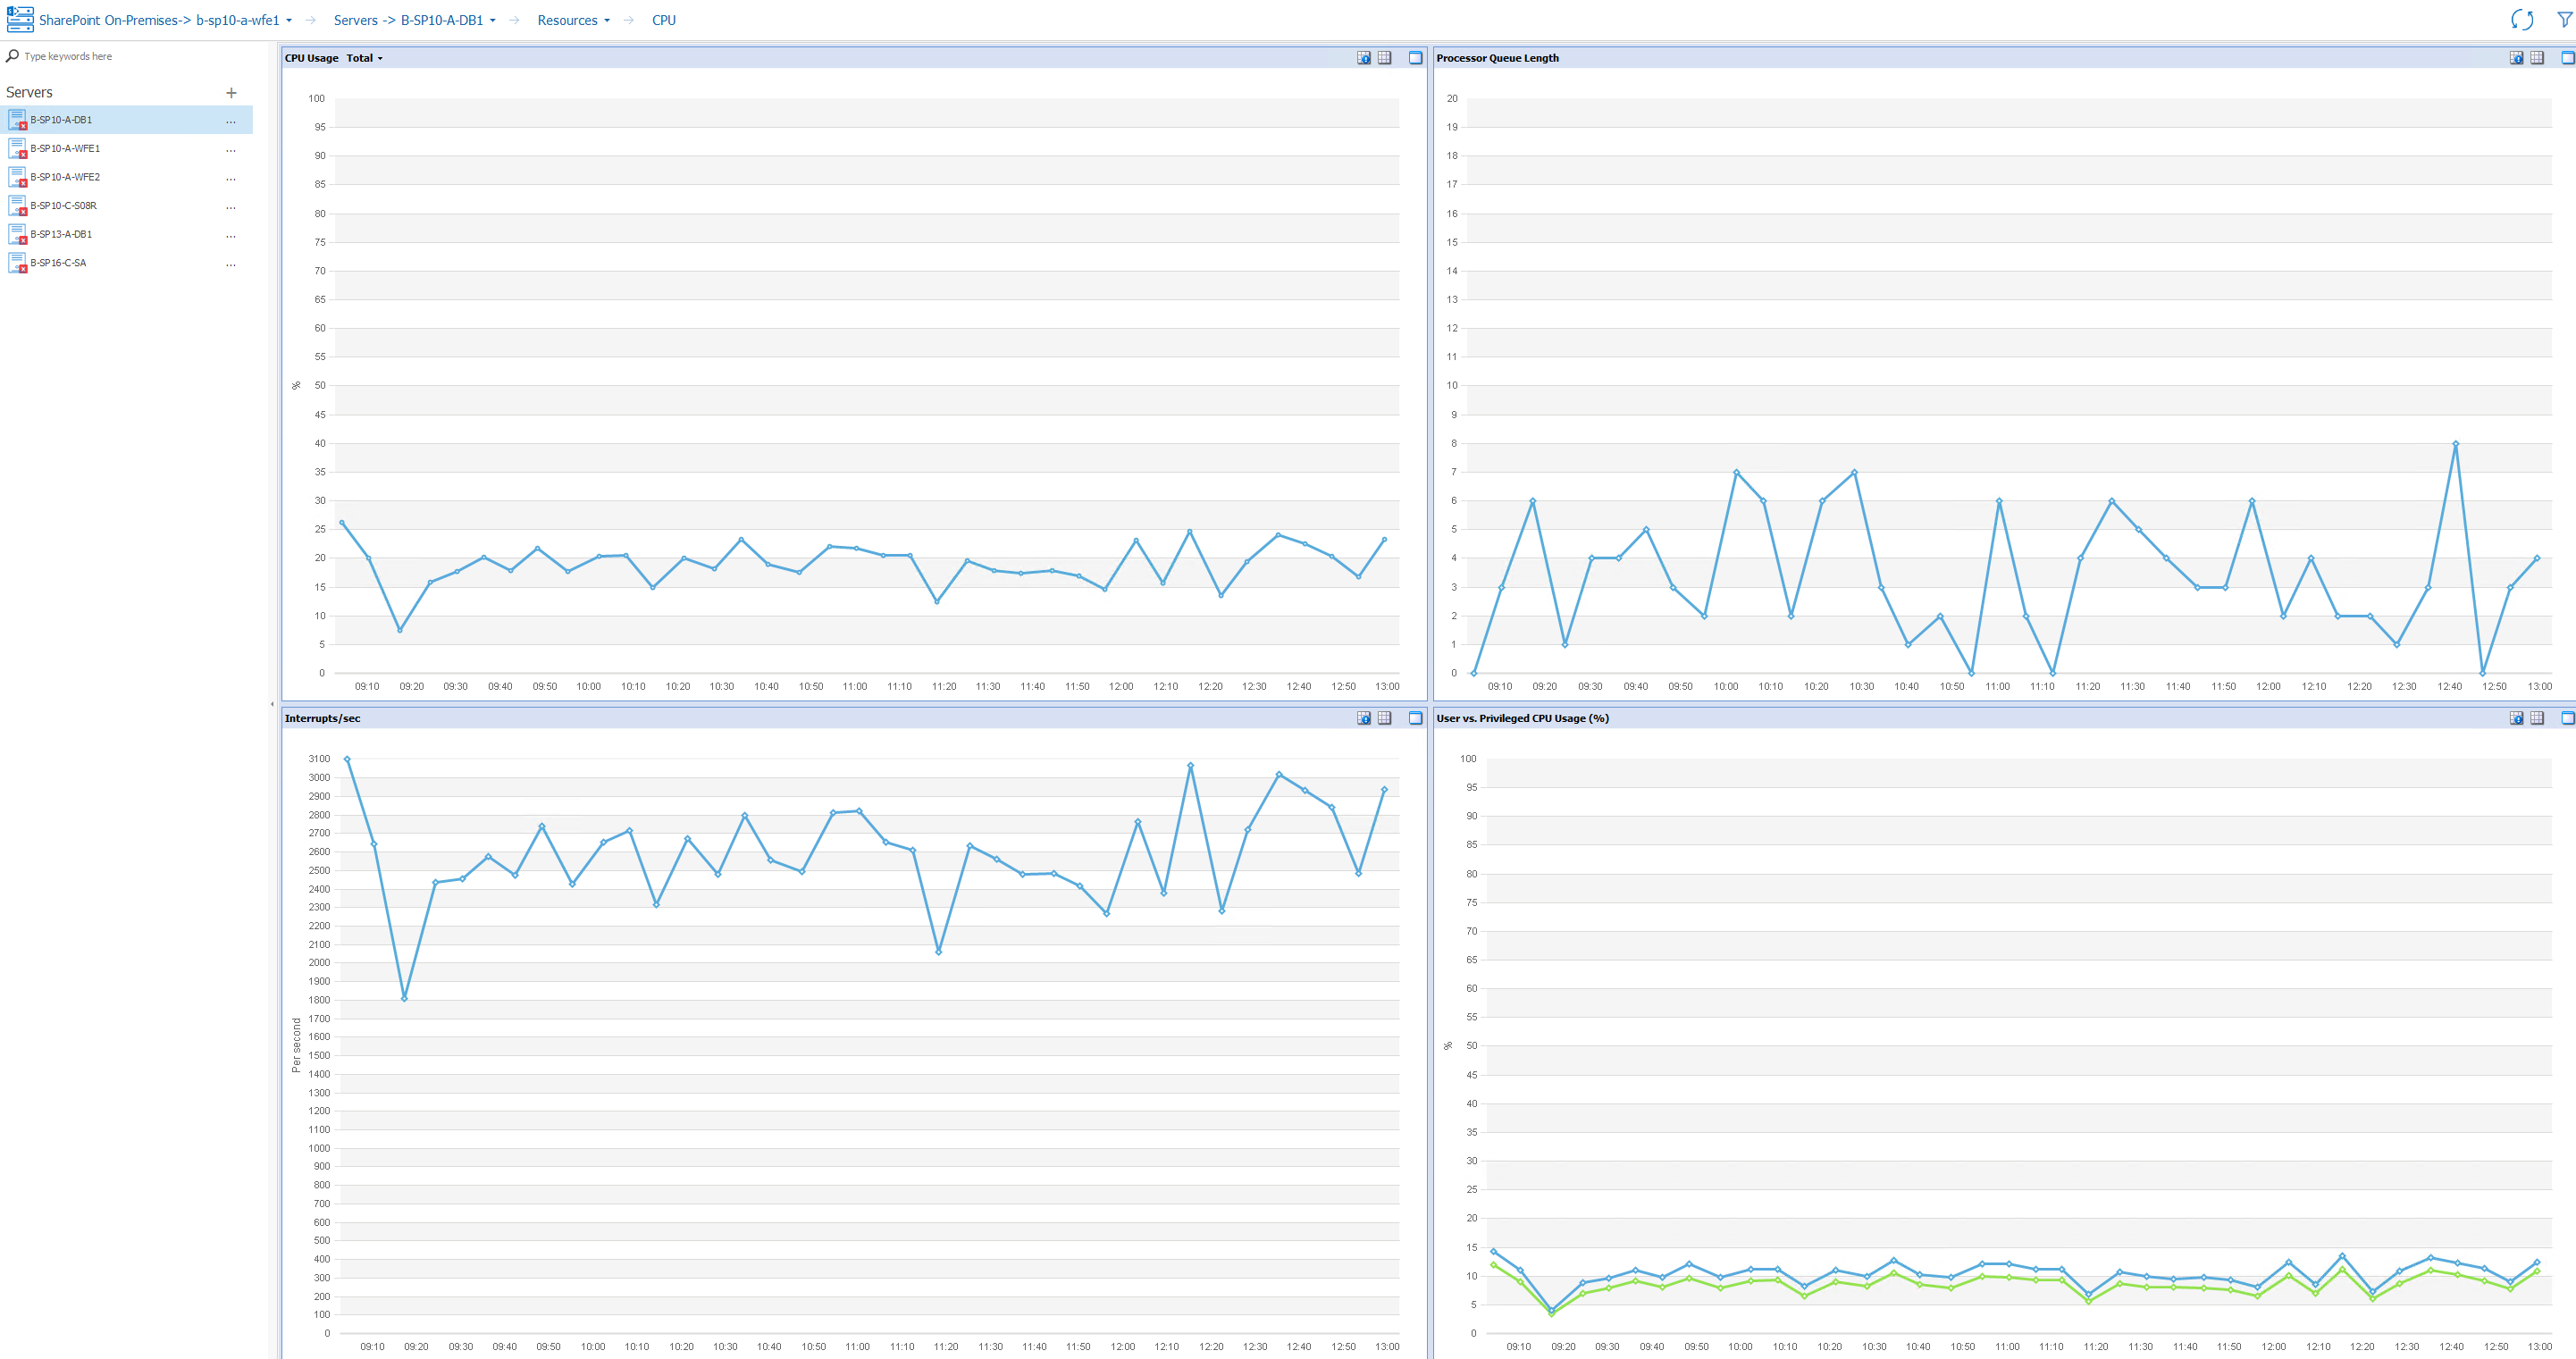
·CPU: Information about the CPU for the selected server.
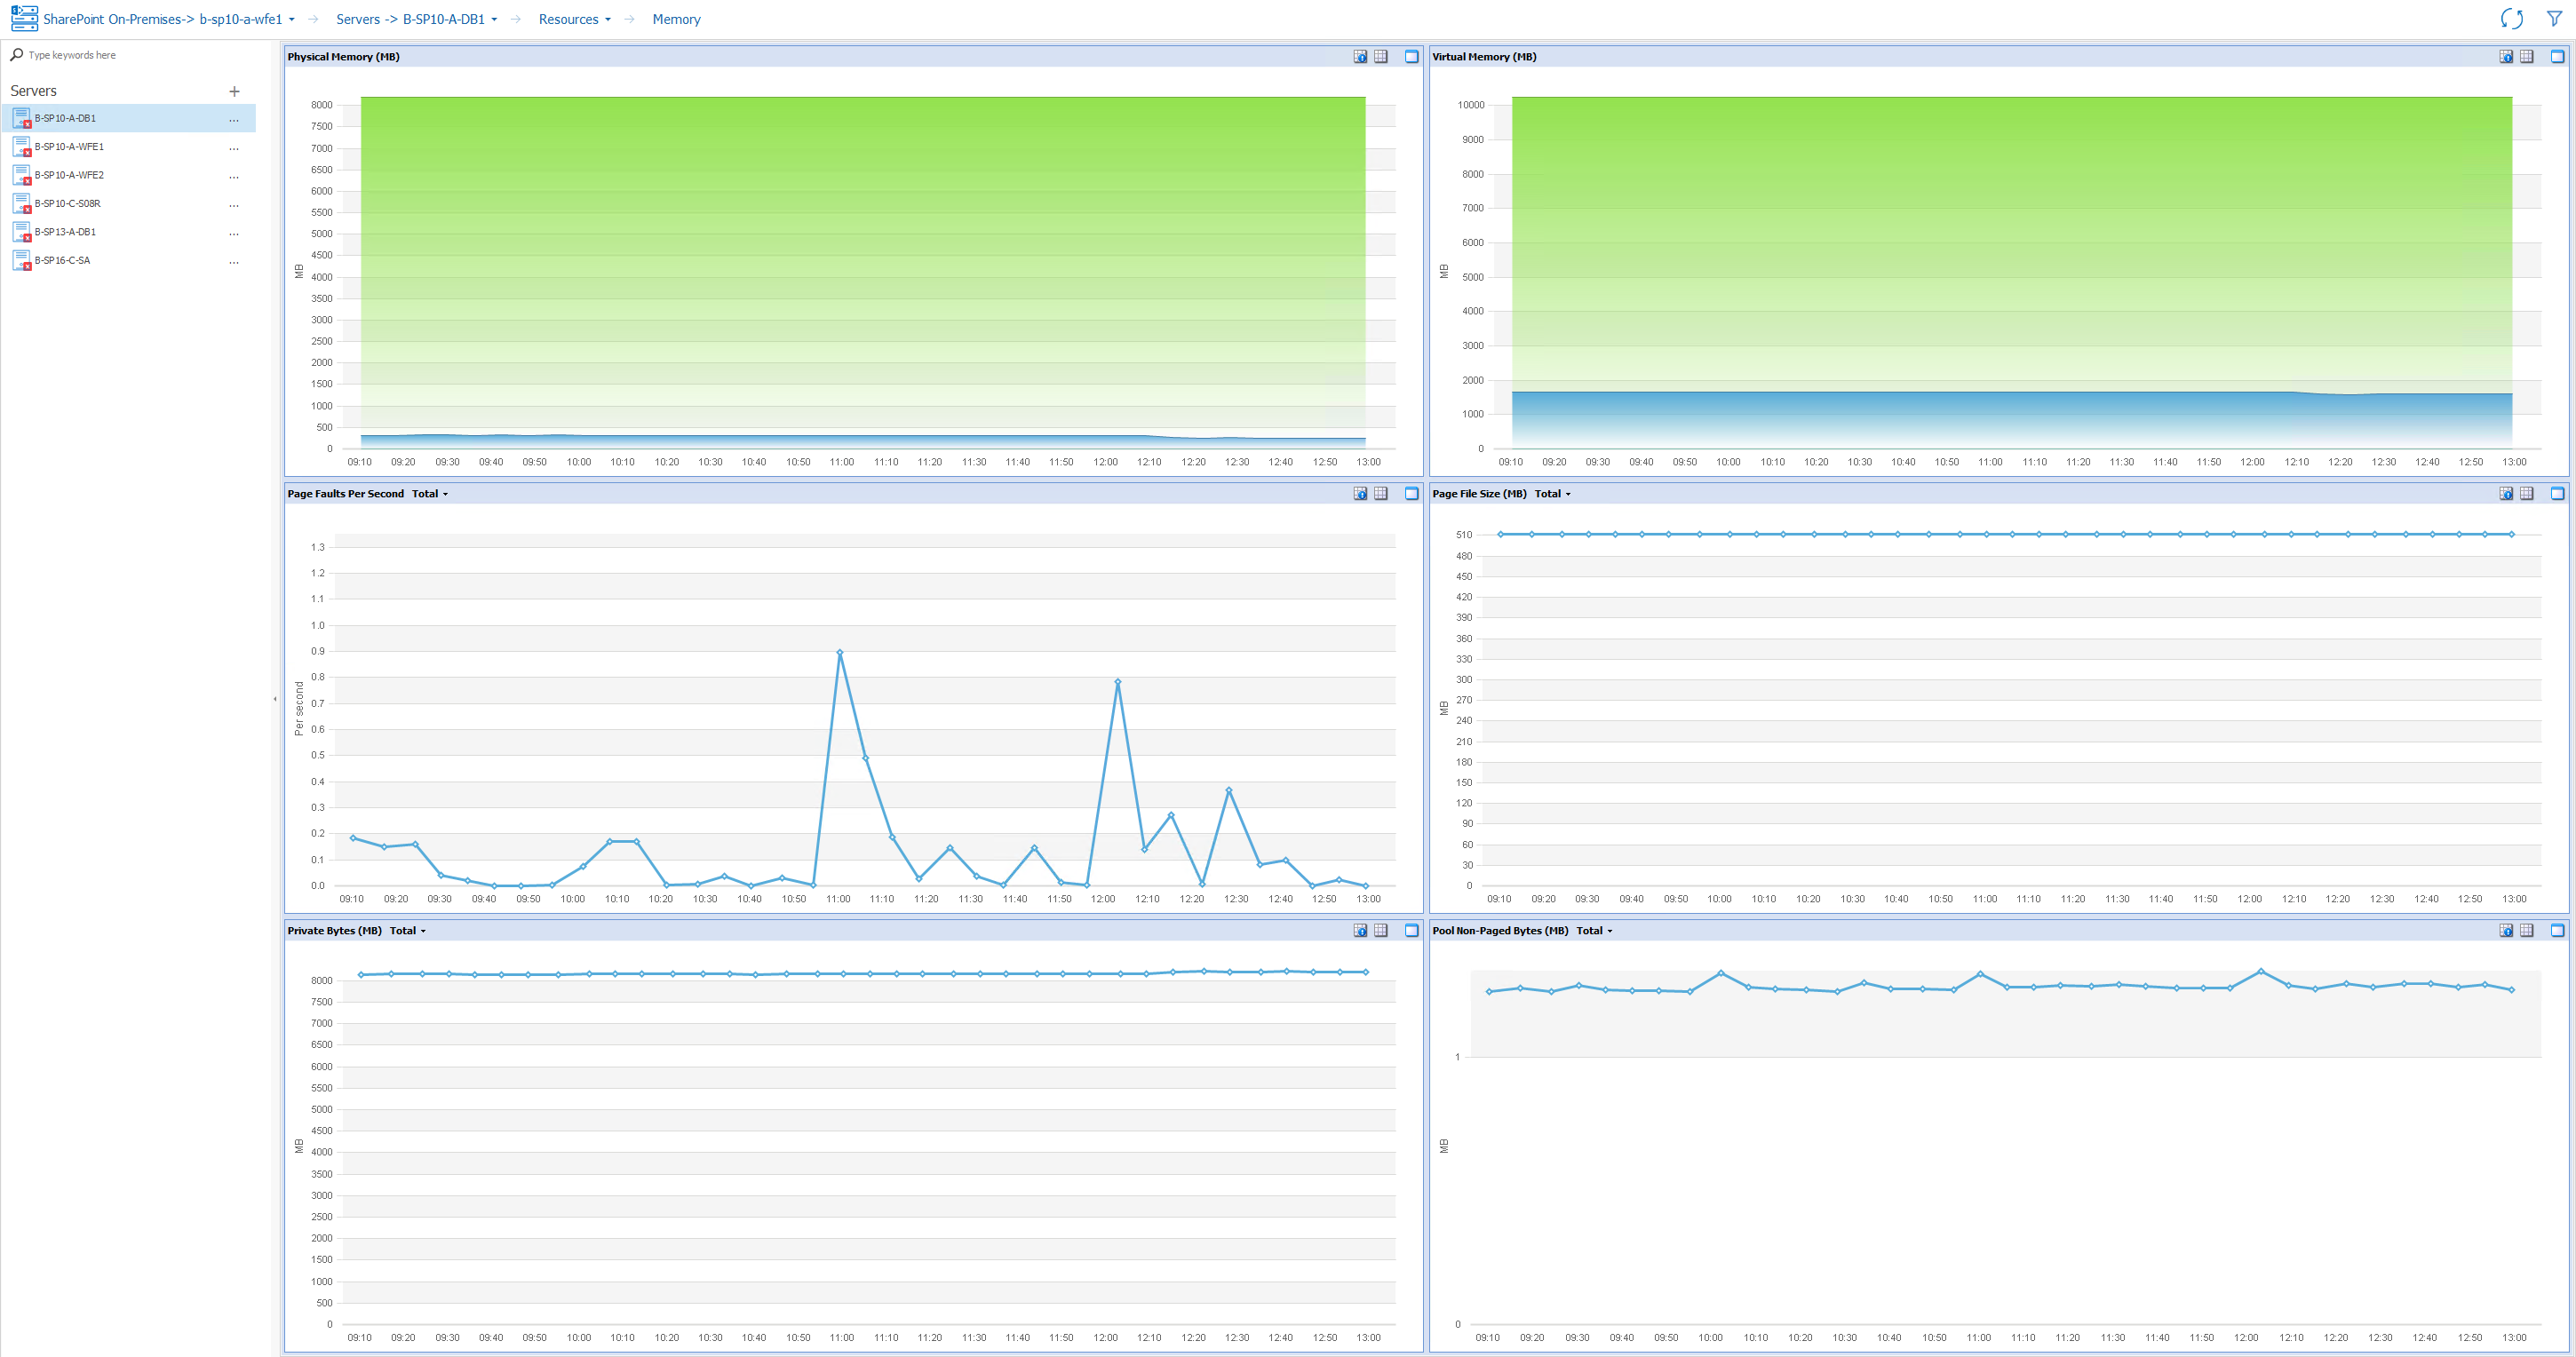
·Memory: Information about memory usage on the selected server
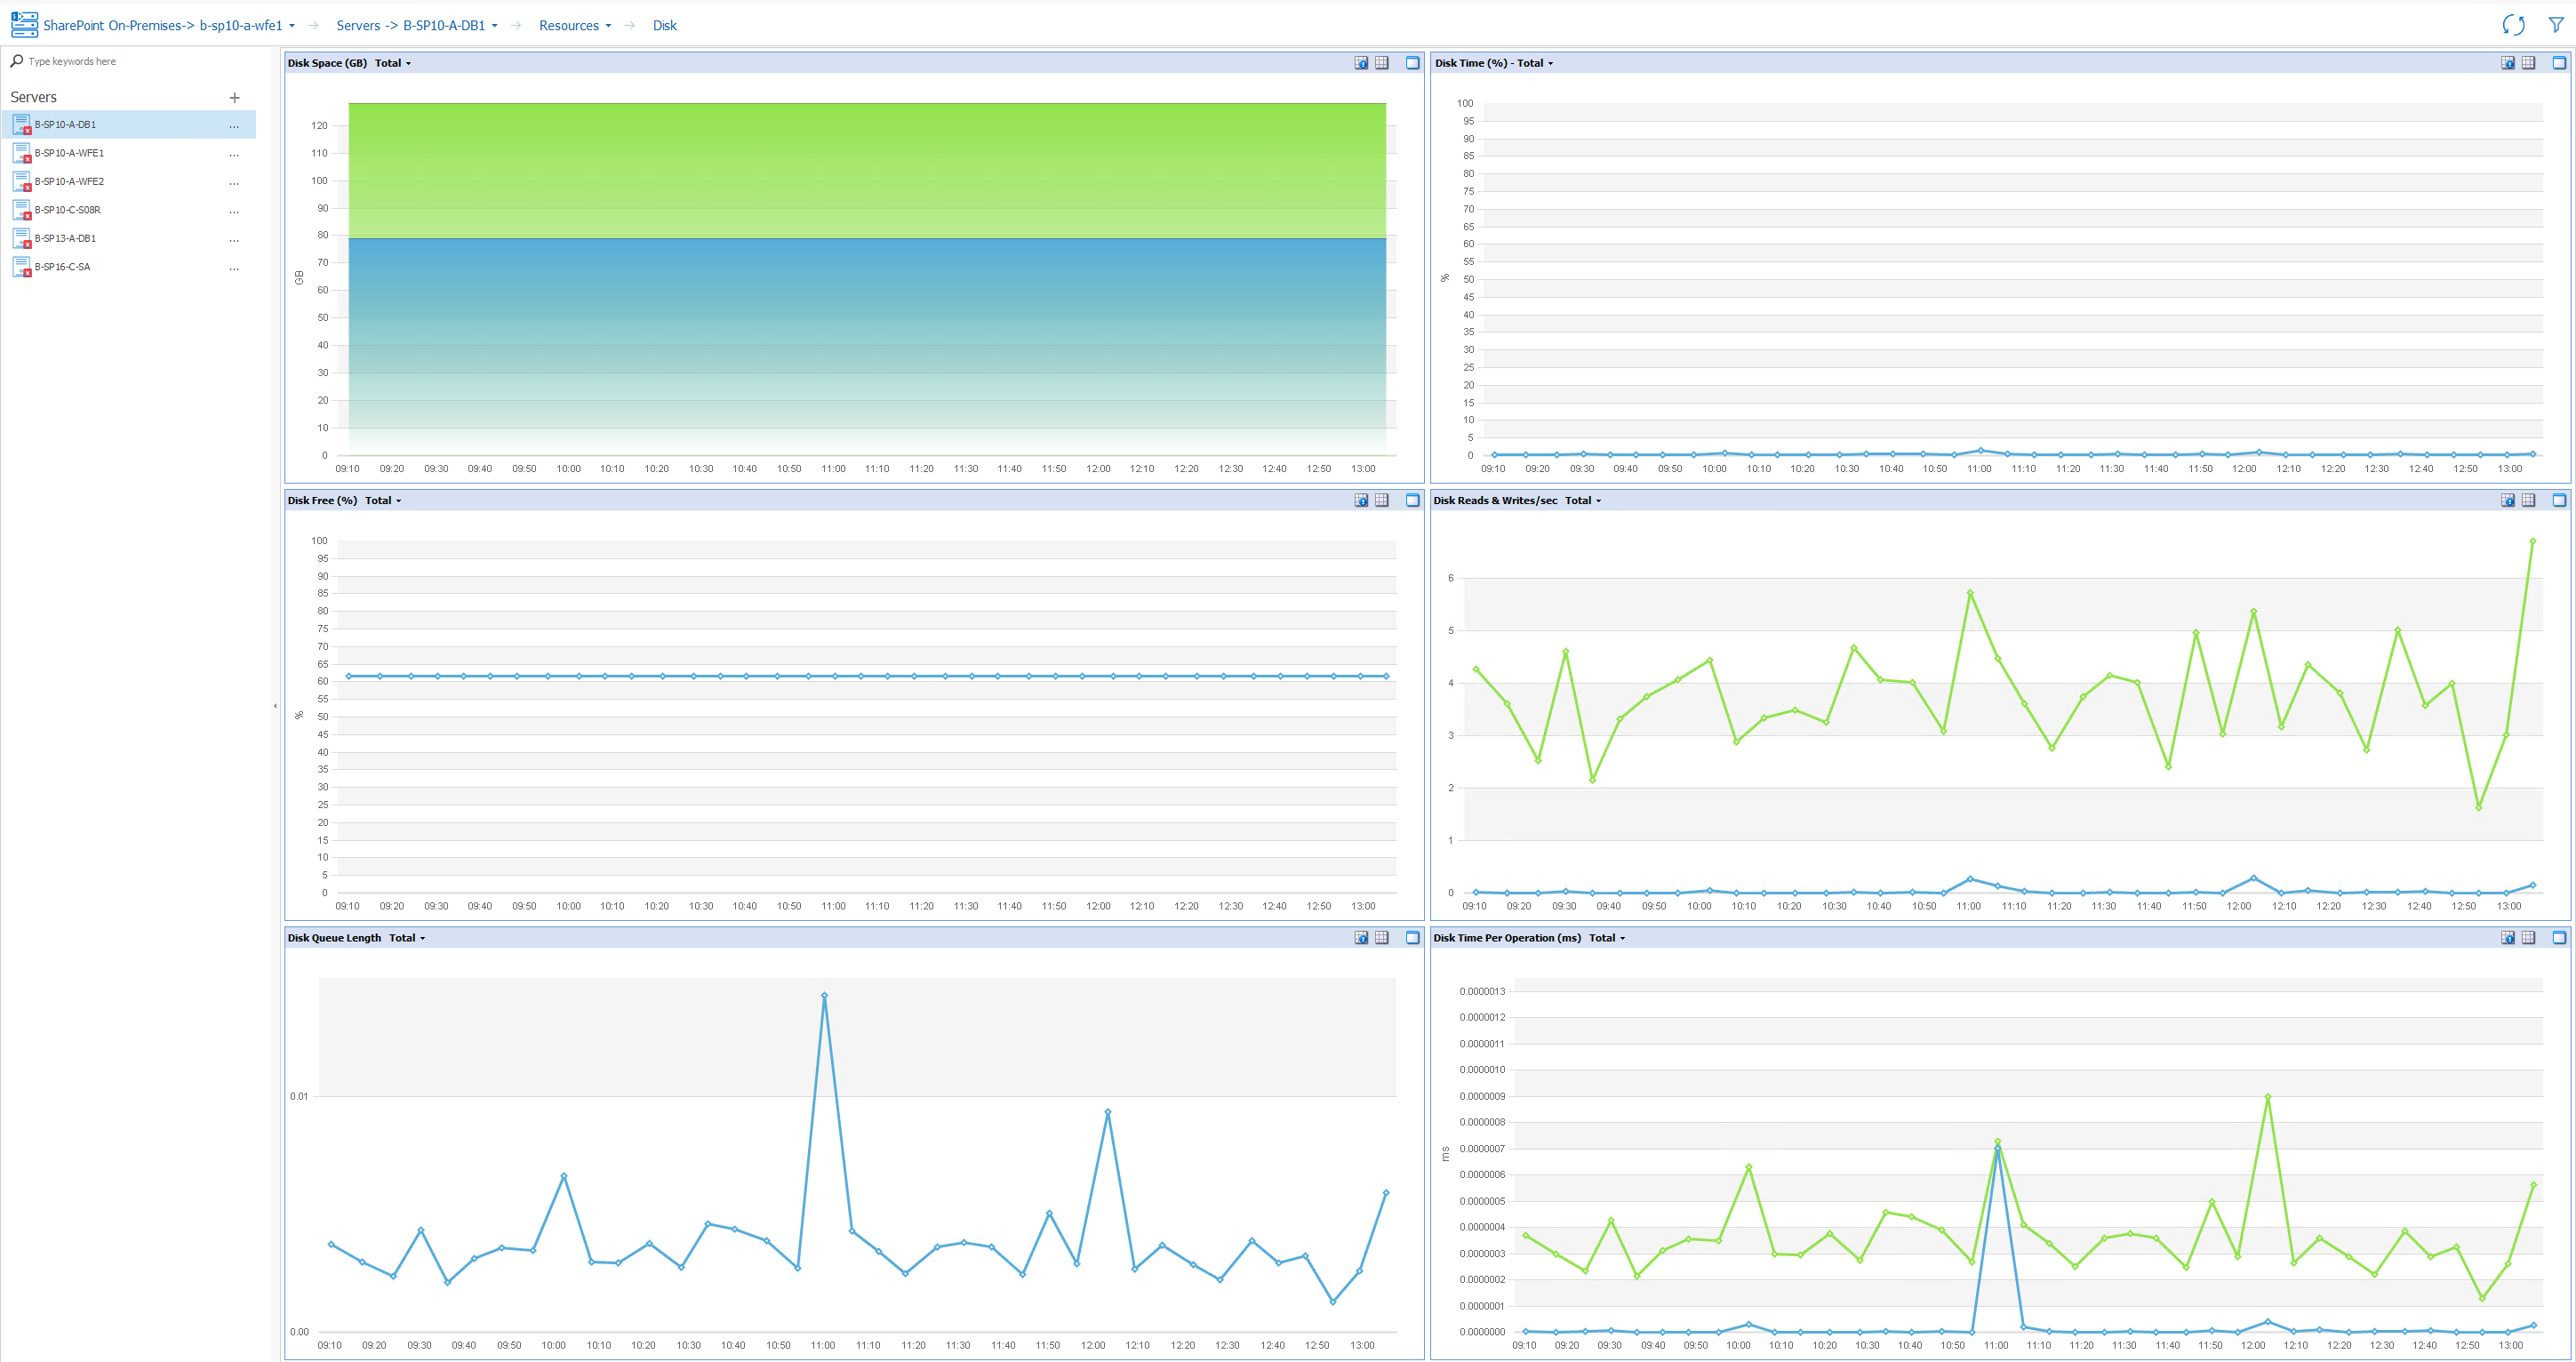
·Disk: Information about the Disk usage on the selected server.
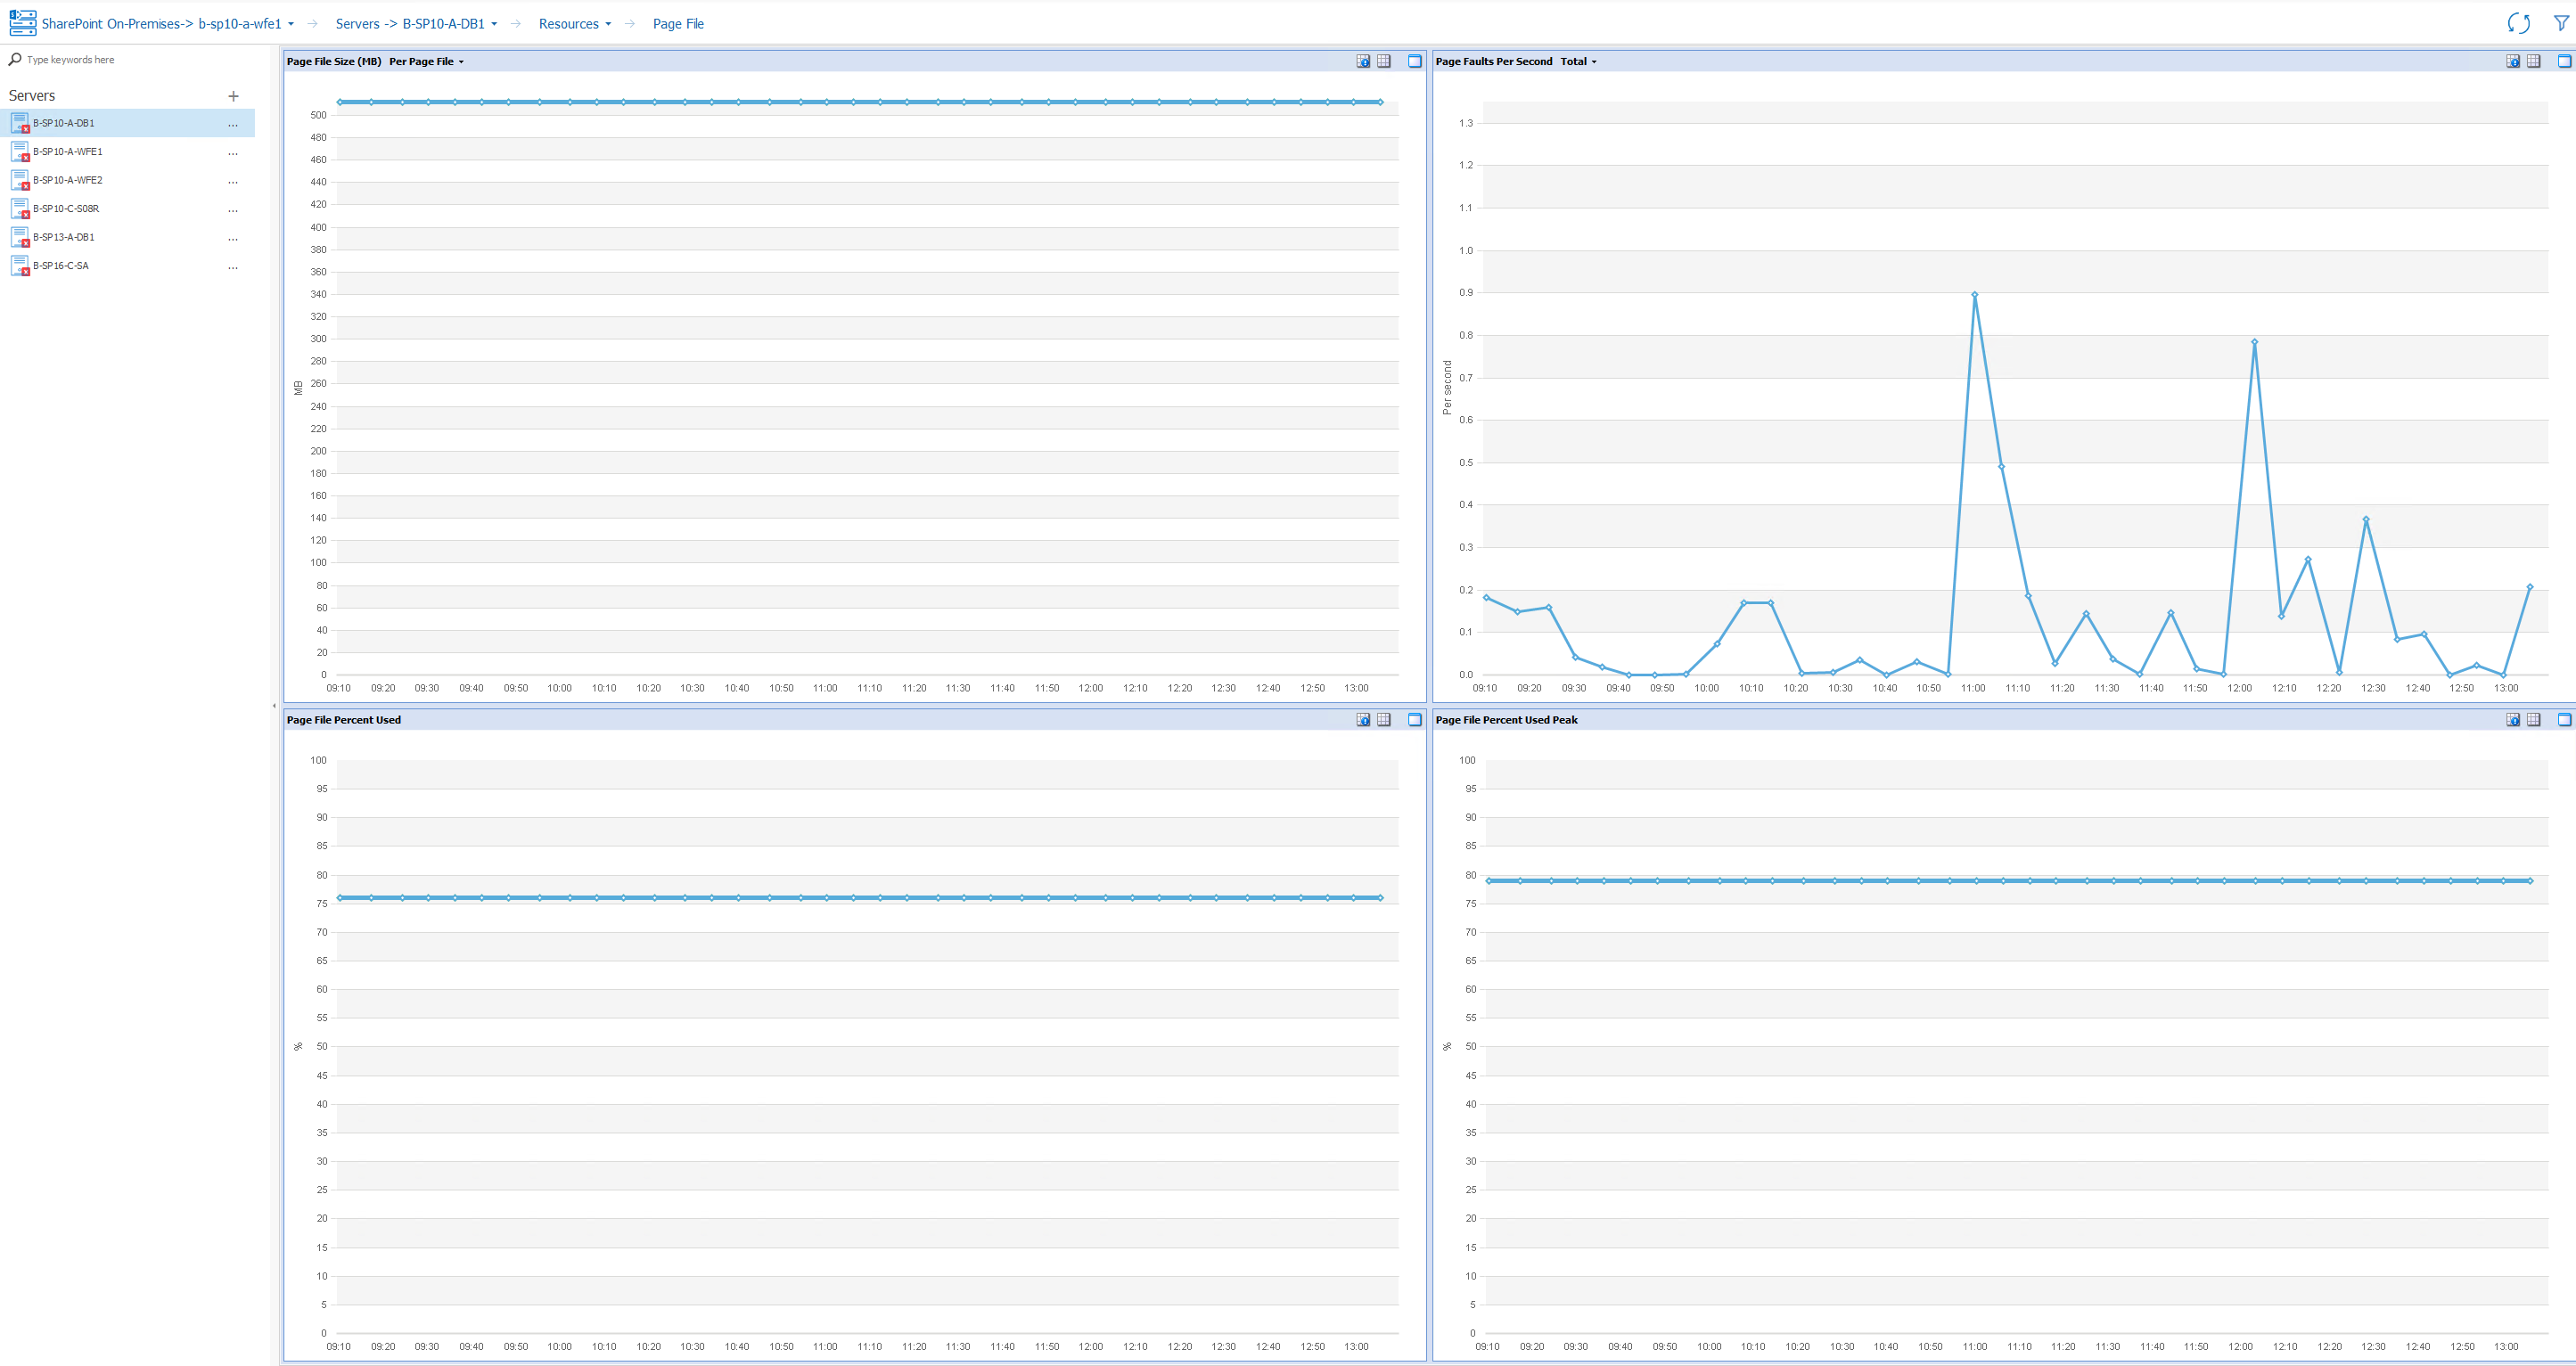
·Page File: Information about the page files in use on the selected server.
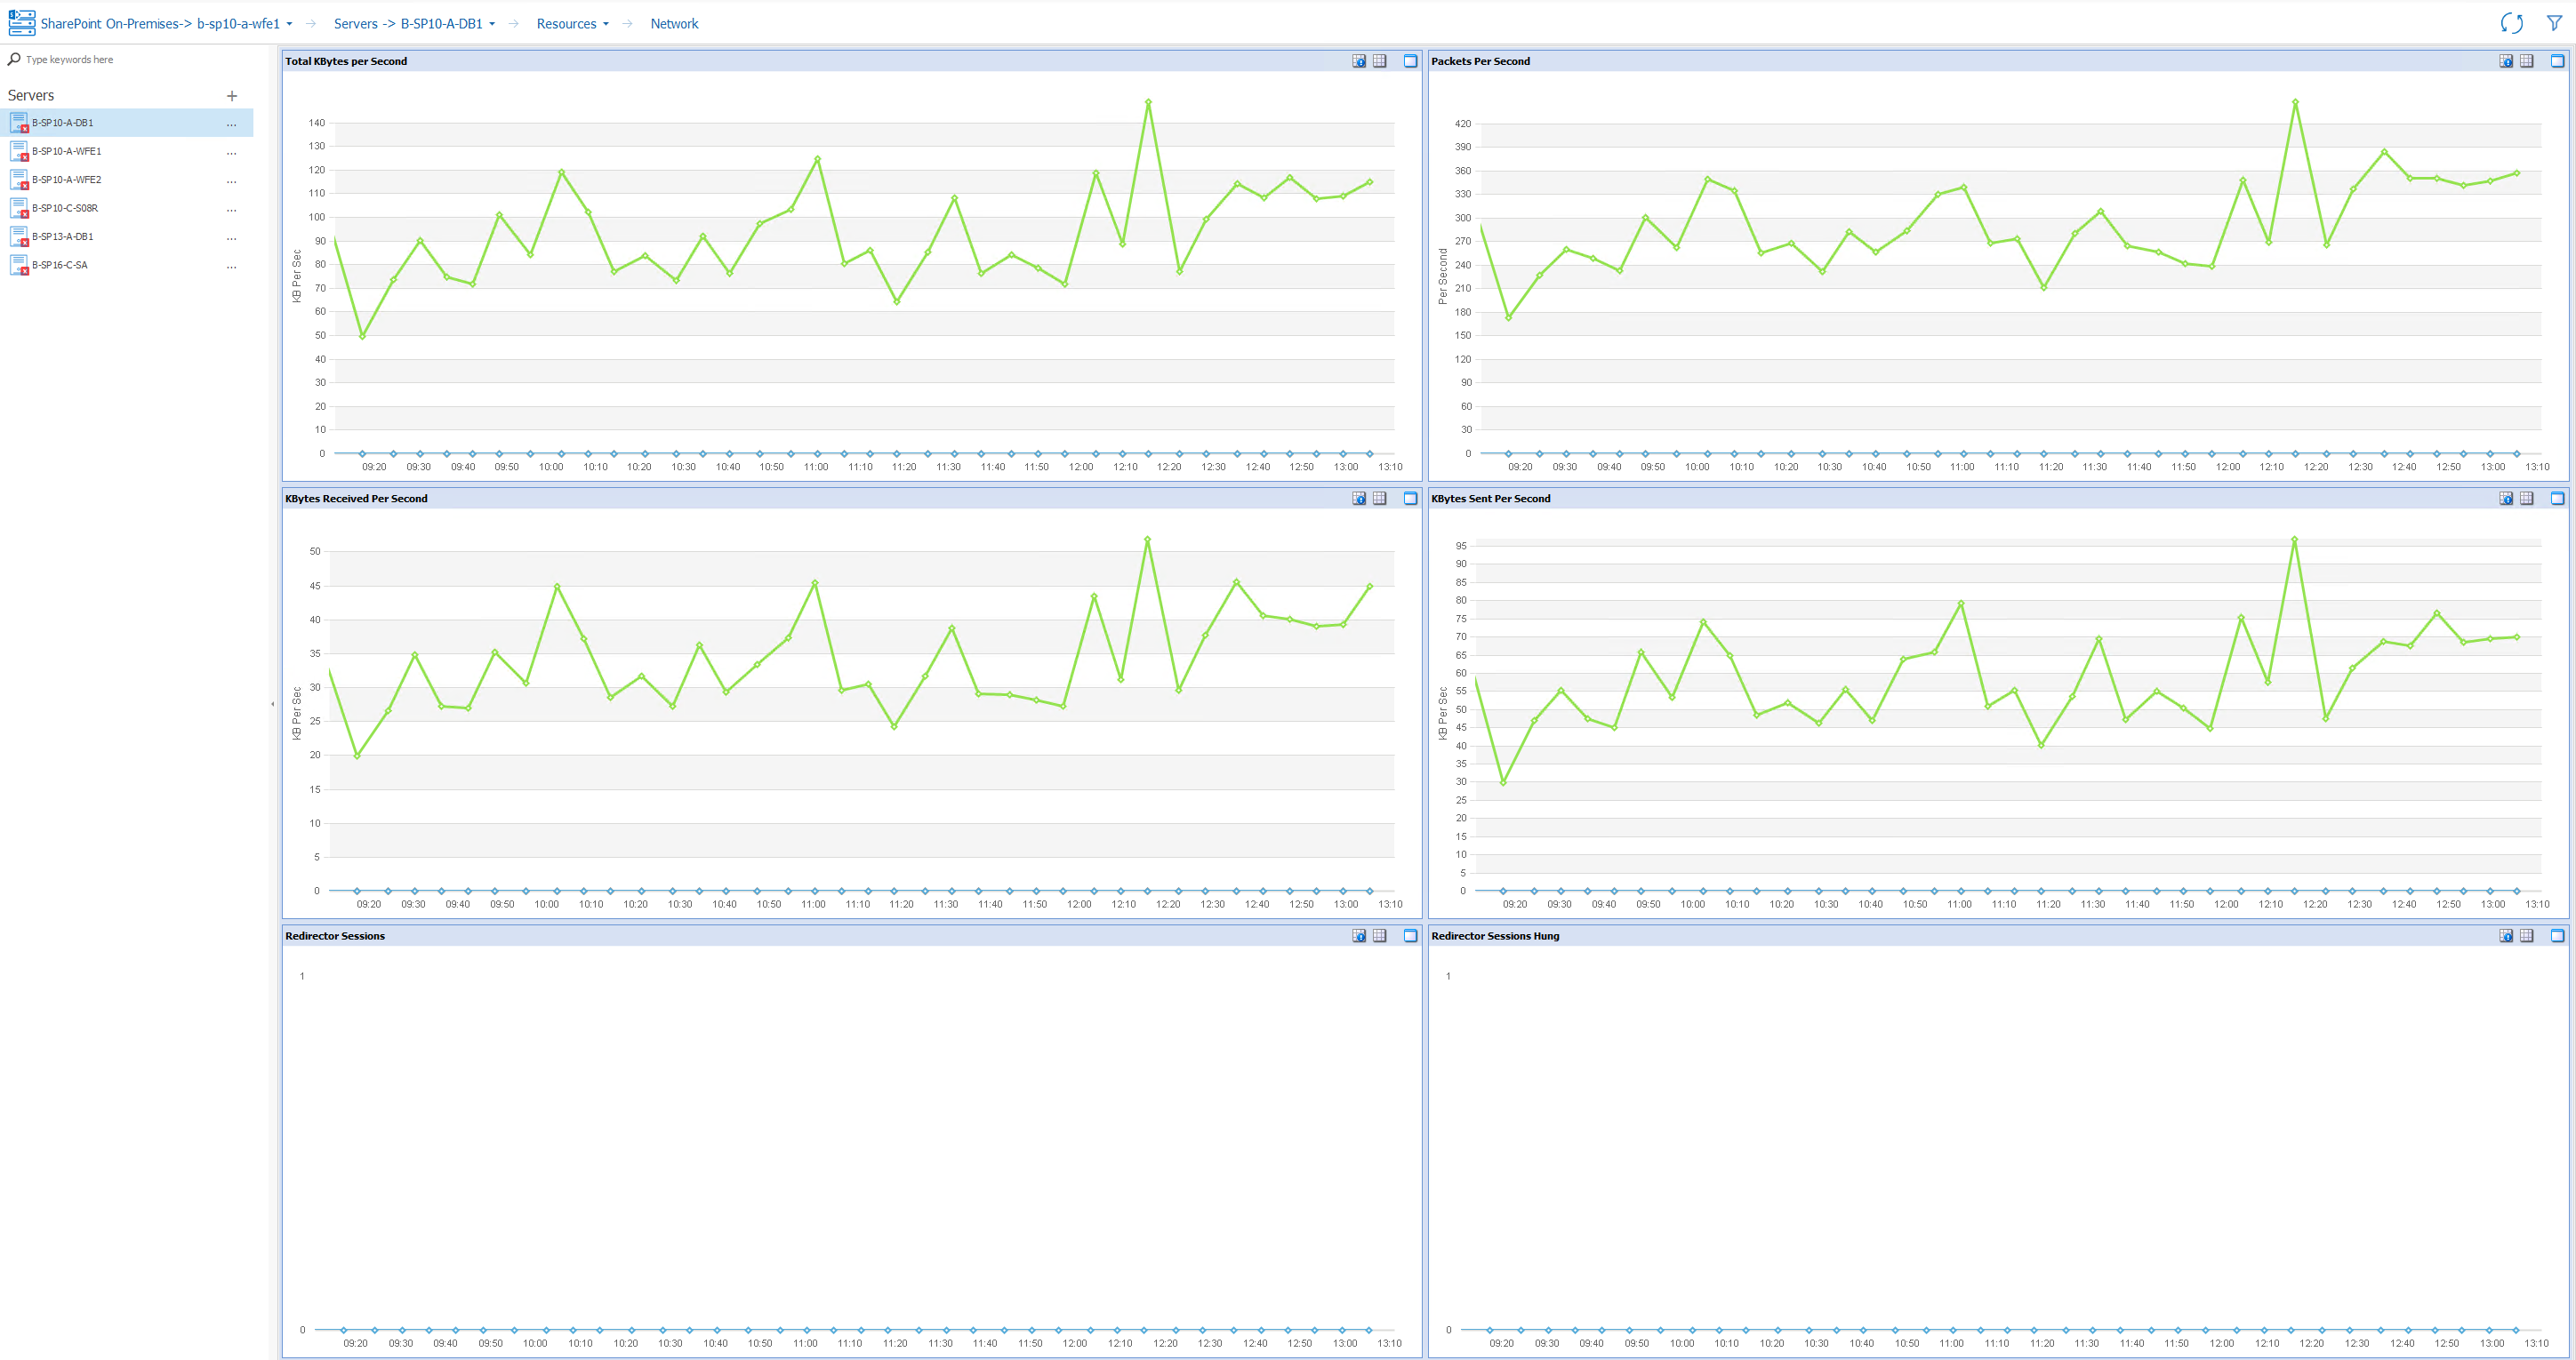
·Network: Information about the network usage for the selected server.
·Windows Services: provides an overview of the windows services for the selected server.
See also Working with Graphical Server Data.
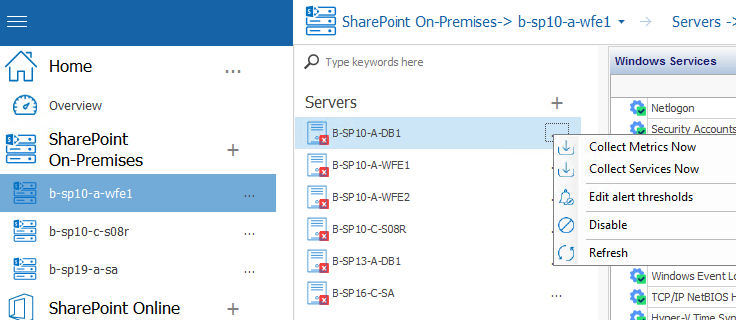
To force immediate data collection:
In the Server section of the ribbon, choose the (...) beside the server for which you would like to collect data, and select Collect Metrics Now from the drop down menu.
To make changes to the Alert Thresholds for the server metrics:
Viewing the Status of Windows Services
From the Resources tab of the Server view, you can view the status and properties of Windows Services on a selected server. You can also act on Services from within the Management Console.
When data is collected for Windows Services
The Metalogix Diagnostic Manager Collection Service retrieves Window Service status information on a schedule that you specify in the Collection Service Options dialog. By default, the Collection Service retrieves this data every six minutes.
To view the status of Windows Services on a server:
1.Double click on the server for which you want to see the resources, this will open the overview pane for that server.
2.Select the Server name above the overview pane, this will produce a drop down panel, select Resrouces from this panel.
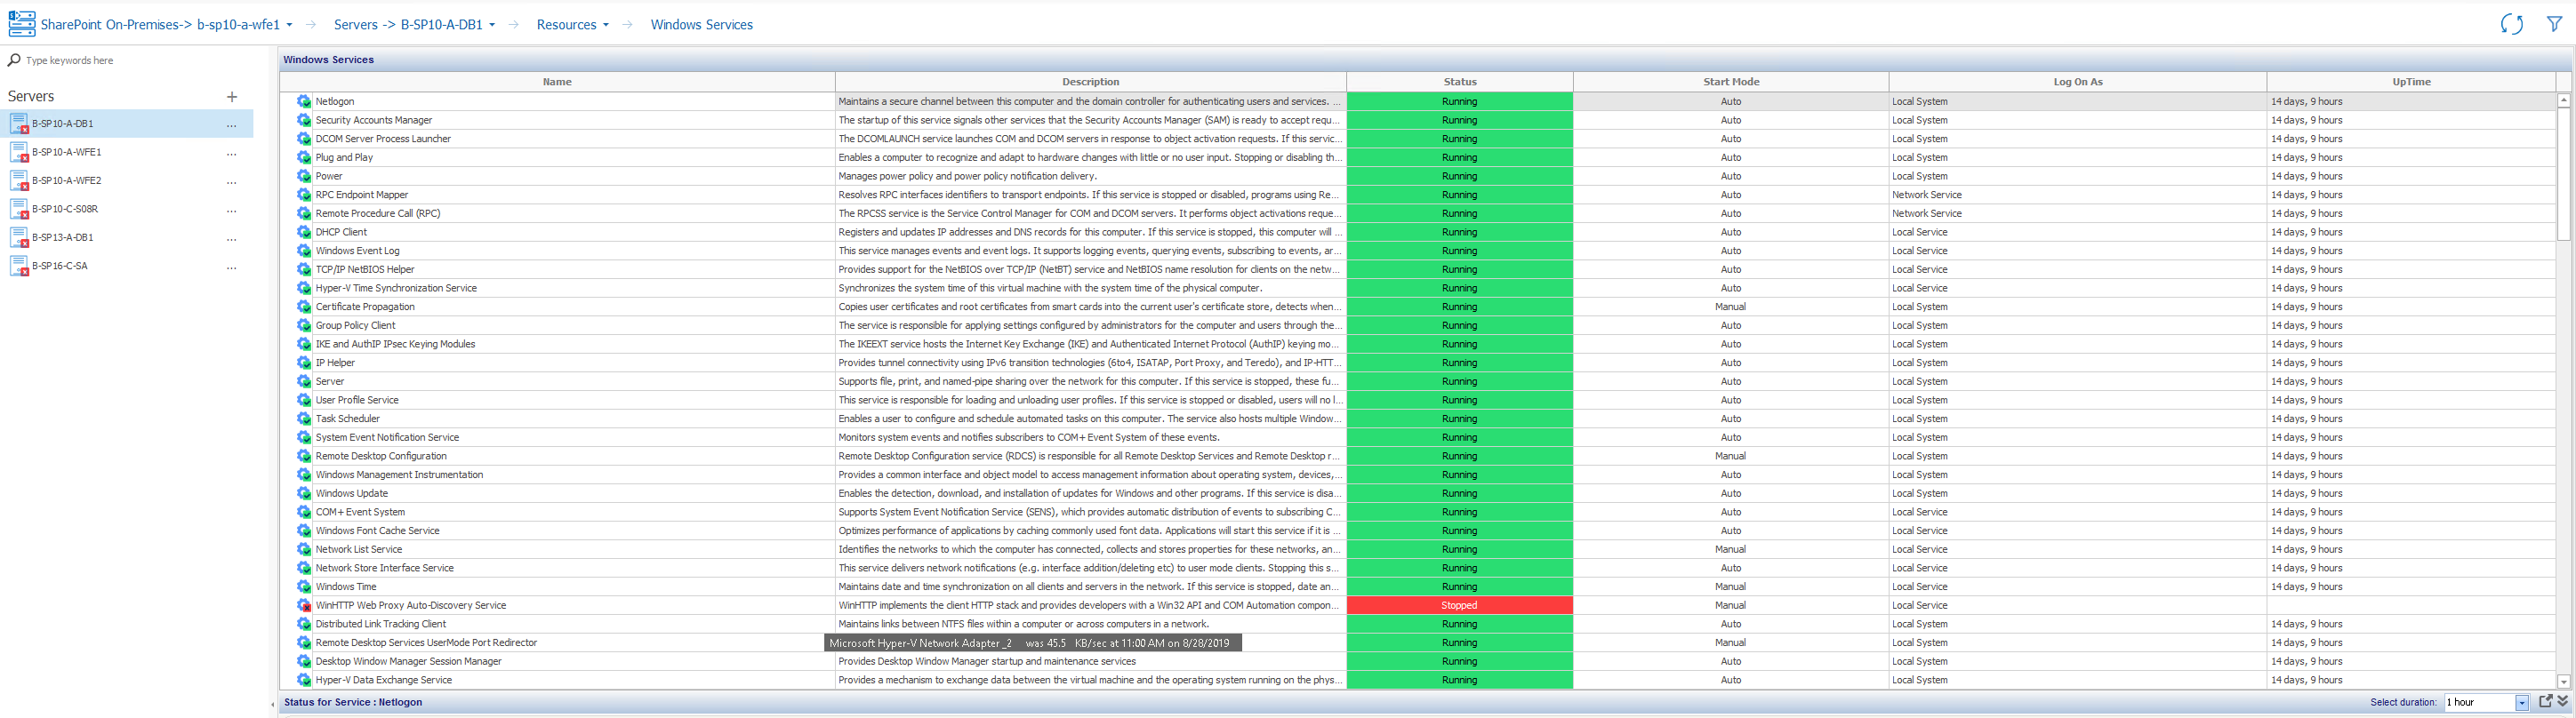
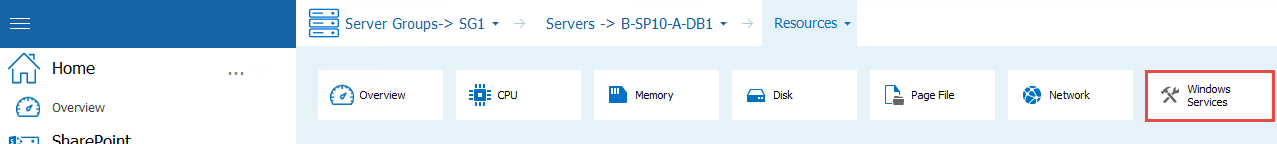
3.In the Resources section of the ribbon, select Windows Services.
Details about each service on the server displays, including the number of hours of UpTime since the last time the service was started. The columns are sortable.
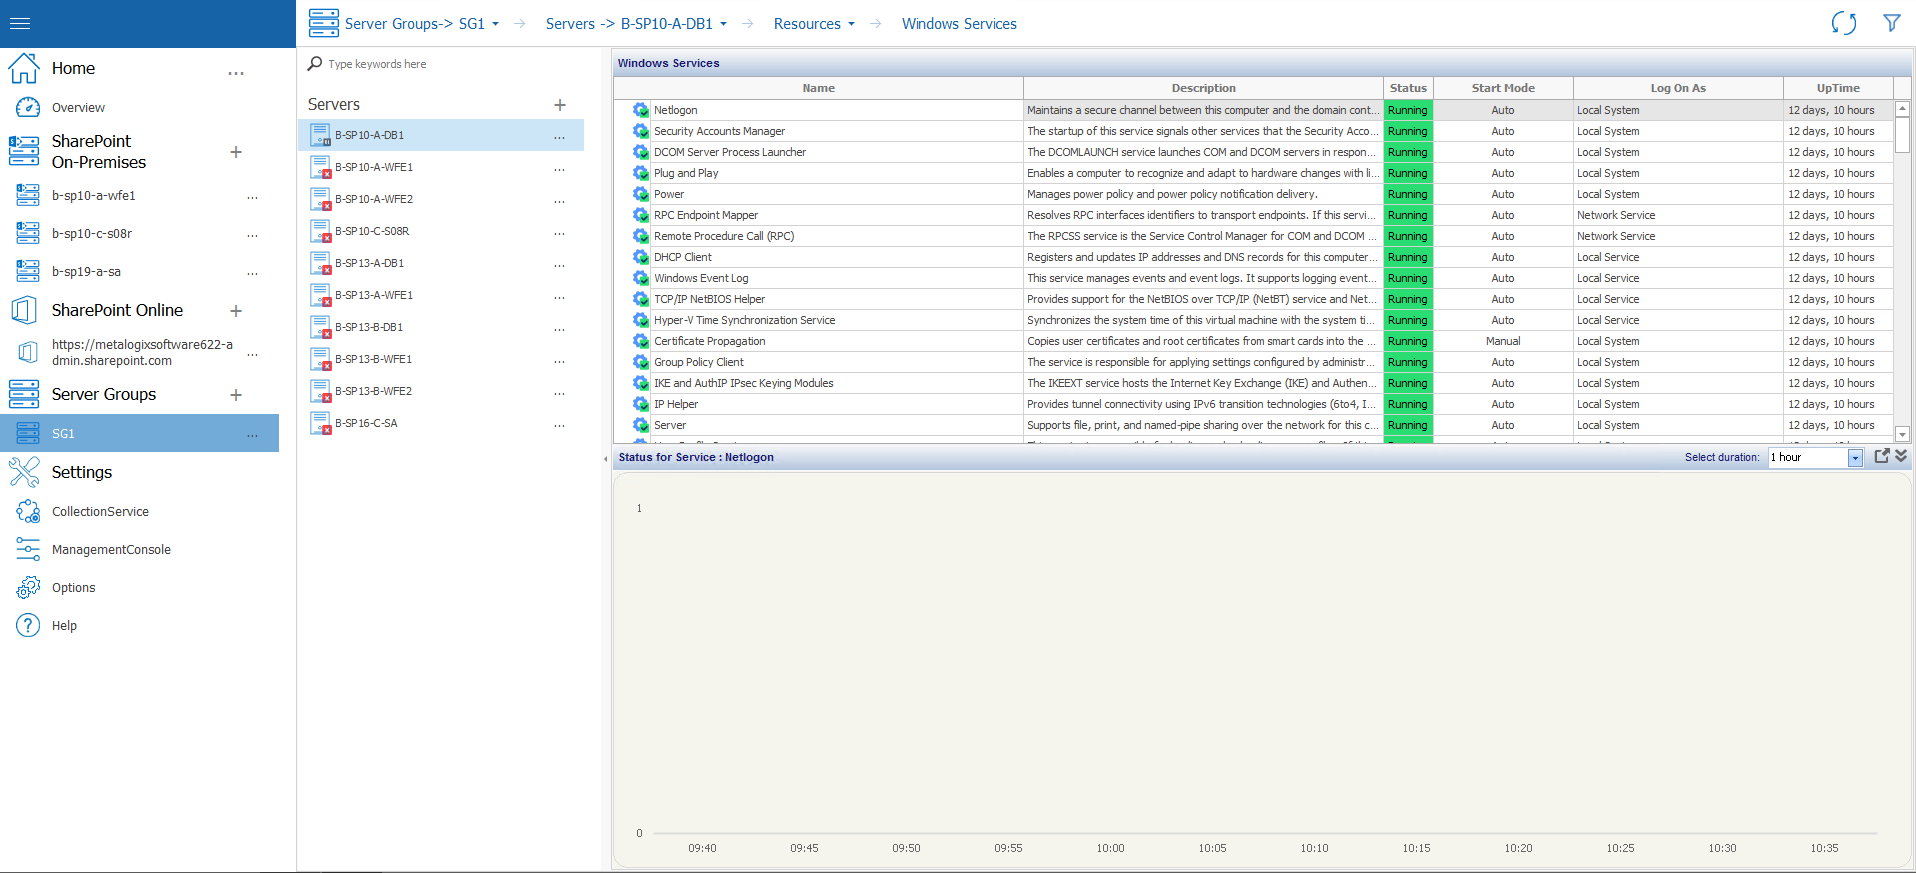
|
|
NOTE: When a Windows Services Status includes (Trigger Start), that designation does not display in the Management Console for any server, regardless of its version. |

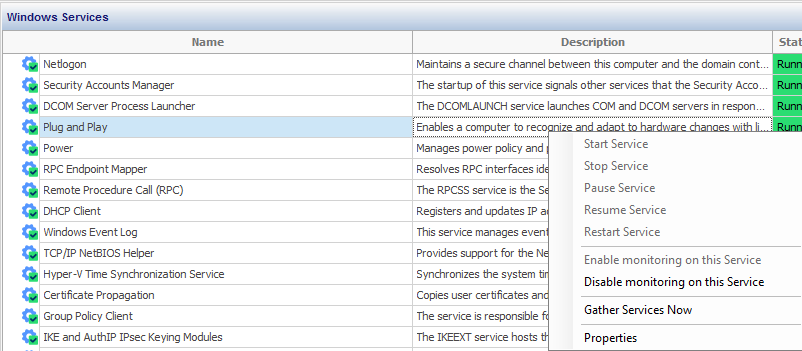
Acting on Windows Services
From the Management Console, you can perform the same actions on Windows Services that you can from the server on which the Services reside. You can also enable/disable monitoring and collect Service data immediately.
To act on a Windows Service:
1.In the Windows Services grid, select the service you want to act on.
2.Right-click and choose the action you want to perform. Options are:
§Start Service (if the Service is currently Stopped)
§Stop Service (if the Service is currently running)
§Pause Service (if allowed for the Service)
§Resume Service (if the Service is Currently Paused)
§Restart Service
§Enable monitoring on this Service
§Disable monitoring on this Service
§Gather Services Now
§Properties