
-
Titre
Performance monitoring of AlwaysOn Availability Groups – Part 2 -
Résolution
In Part 1 of this series using native SQL Server tools for monitoring AlwaysOn Availability Groups performance is described. In this part the focus will be on a third party solution – ApexSQL Monitor; designed to overcome most of the limitations of the aforementioned native SQL Server tools
ApexSQL Monitor
ApexSQL Monitor is a web based SQL Server and Windows performance monitoring tool specifically designed for performance monitoring of Windows operating system, SQL Server instances and database, AlwaysOn Availability Groups and SQL Server Failover Cluster Instances (FCI) performance metrics. ApexSQL Monitor is agentless tool capable for real time monitoring that includes wait statistics, individual query waits statistic and index monitoring. Besides monitoring SQL Server performance, ApexSQL Monitor allows a database administrator to be alerted in real time about performance issues, including the ability for fully configuring the alerts thresholds manually or using the baselining threshold calculations
AlwaysOn Availability Group performance monitoring functionality is integral part of ApexSQL Monitor and besides the ability to track the dedicated AlwaysOn performance metrics, ApexSQL Monitor is designed to provide the user a quick and easy overview of the AlwaysOn Availability Group topology
So, to start monitoring an AlwaysOn Availability Group, the first step would be to add AlwaysOn Availability Group in ApexSQL Monitor. To ensure the easiest way to add AlwaysOn Availability Group monitoring without having to manually add SQL Server AlwaysOn replicas and then to manually create the AlwaysOn Availability Groups, ApexSQL Monitor leverages AlwaysOn listeners as the start point for adding the AlwaysOn Availability Group. Detailed steps on how to add AlwaysOn Availability Group for monitoring is available in the How to add AlwaysOn Availability Group for monitoring knowledgebase article. For the purpose of this article, only the necessary steps will be presented, for better understanding of article.
Since accessing the listener ensures that the primary replica of desired AlwaysOn Availability Group is fully exposed, after adding the primary replica ApexSQL Monitor will resolve all the remaining secondary replicas of the targeted AlwaysOn Availability Group as well. The only step that is required by the user in this case is to enter the IP addresses of the discovered replicas
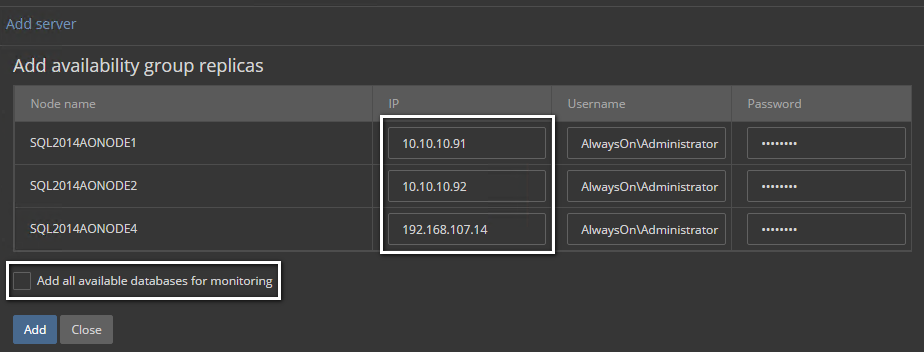
By default, ApexSQL Monitor will include only the databases that are the part of the specific AlwaysOn Availability Group for monitoring, but the application is still flexible enough to allow adding all databases that are hosted by any SQL Server replica instance, by simply checking of the Add all available databases for monitoring
After pressing Add, the AlwaysOn Availability Groups will be added for monitoring and this (see next) is what the user can see after selecting the AlwaysOn dashboard
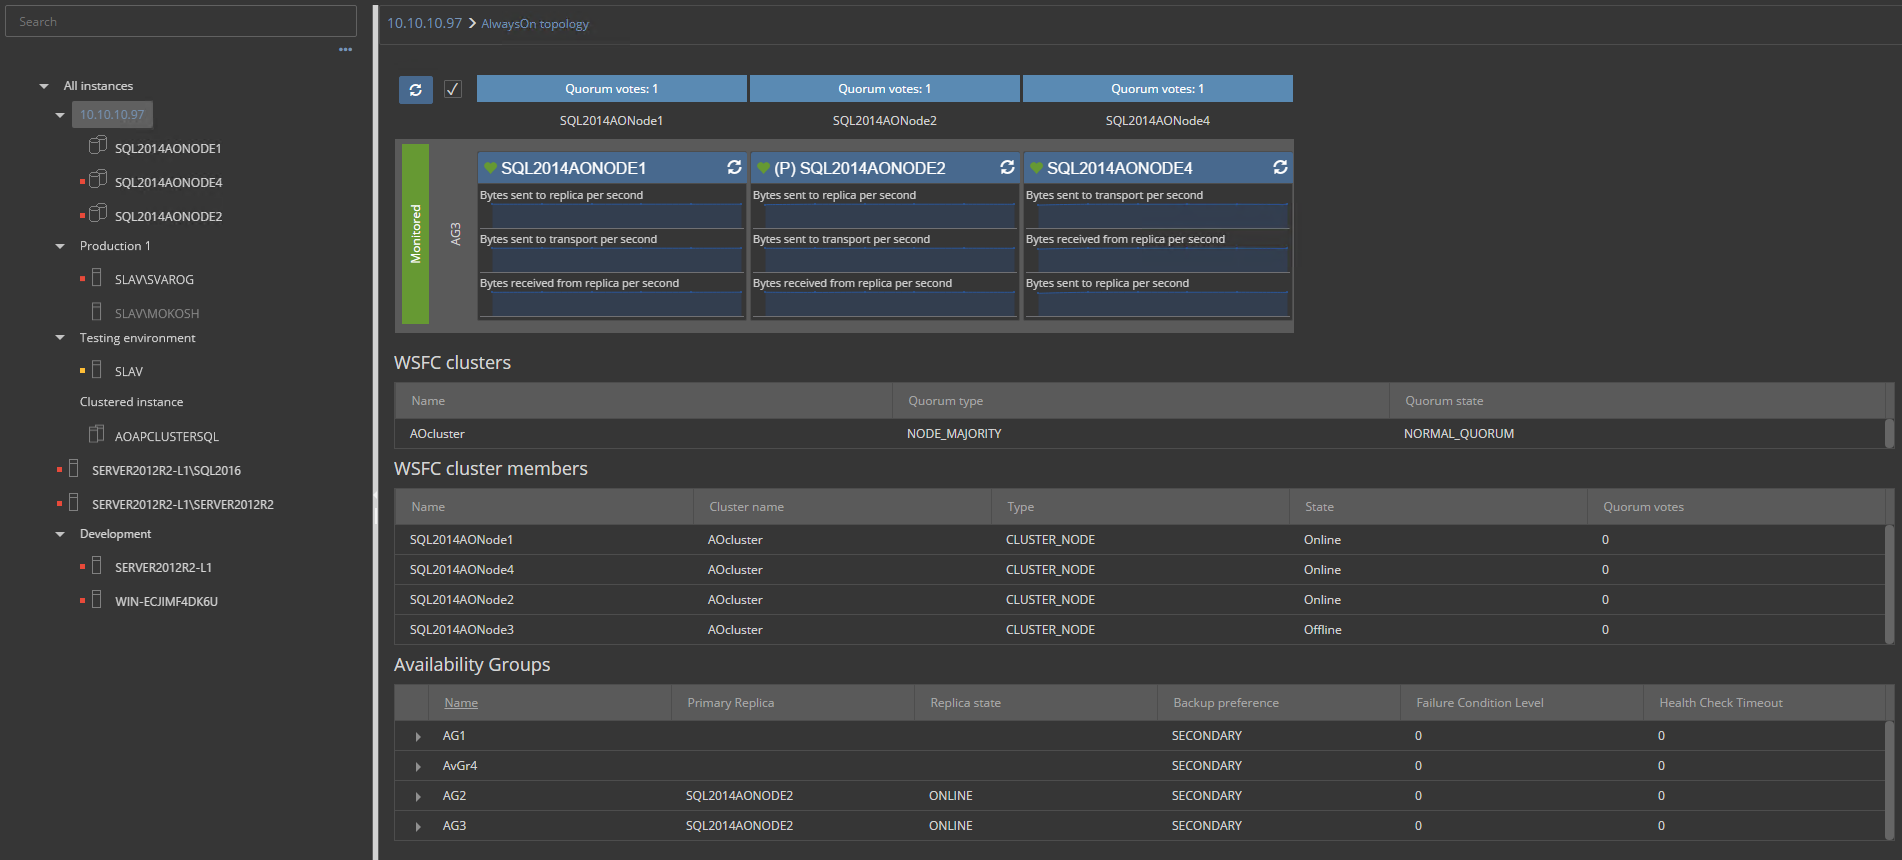
By default, only the monitored AlwaysOn Availability Groups will be displayed in the dashboard,
but there is a “small” bonus for ApexSQL Monitor users, as ApexSQL Monitor will not only resolve the added AlwaysOn Availability Group, but it will automatically resolve and present in the dashboard all AlwaysOn Availability Groups that are share the same WSFC nodes or SQL Server instances. To see the full Always On topology, uncheck the “Show only monitored availability groups” checkbox
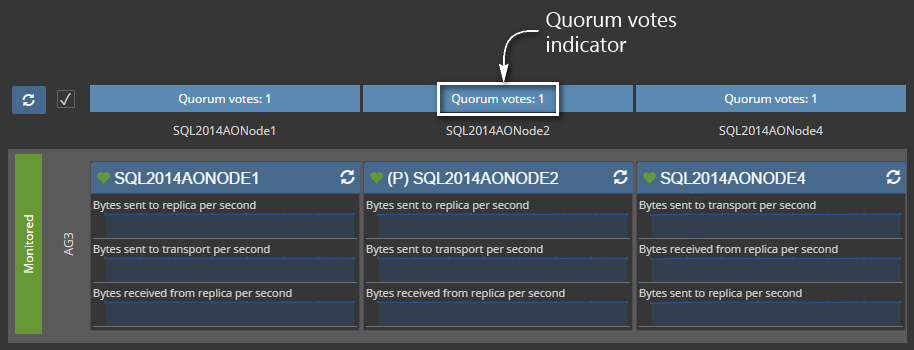
In addition, it is easy to know whether the WSFC member has a quorum vote or not, and if it has, how many votes it have.
By making the full topology of all AlwaysOn Availability Groups available after adding just one of them, the user can get immediate insights into the full AlwaysOn, infrastructure including how replicas are distributed across the WSFC nodes, even when only a single AlwaysOn Availability Group will be monitored.
The graphically conveyed topology displays the essential AlwaysOn metrics as charts within the AlwaysOn replica panel, such as Bytes sent to replica per second, Bytes sent to transport per second and Bytes received from replica per second. To get more detailed information about the replica, click on the
 panel button which will flip the panel revealing the more information
Selecting the rotate button at the top left corner of the AlwaysOn topology diagram will rotate all displayed AlwaysOn panels at once
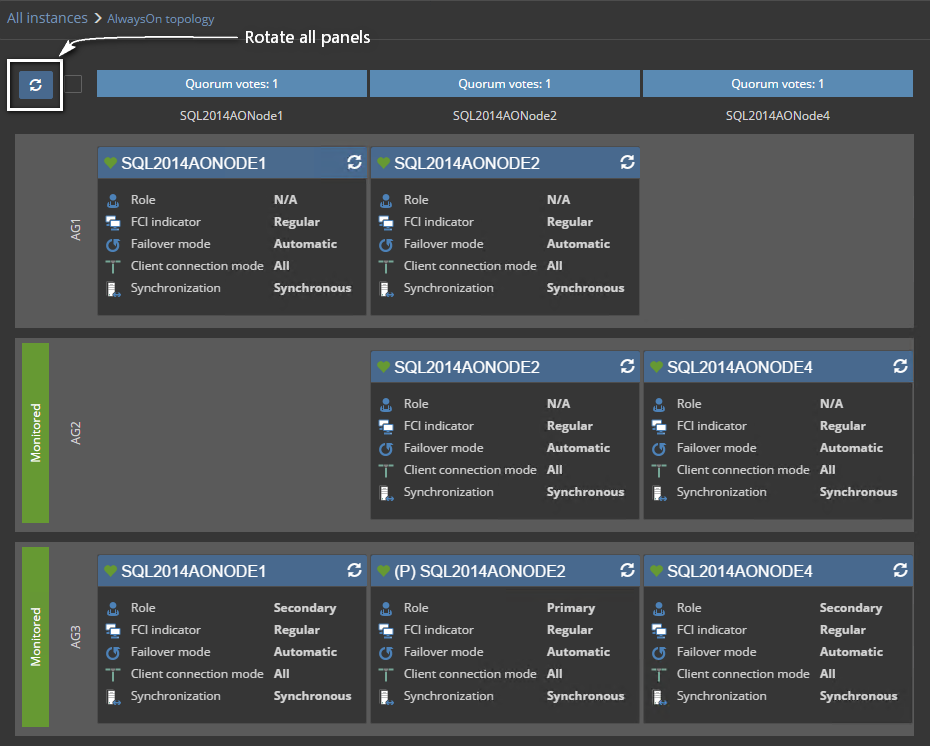
Just by looking at the AlwaysOn graphical presentation, most of the AlwaysOn Availability Group information can be seen at a glance via visual indicators for each replica
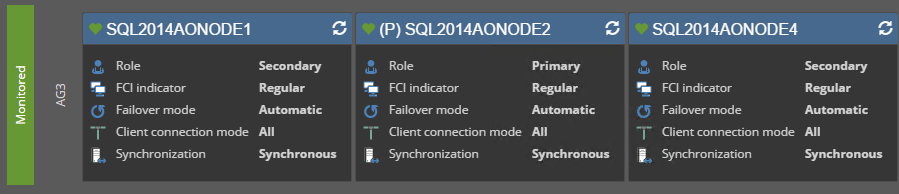
From the information displayed, the user can easily see that AG3 contains three replicas on three WFC nodes. It is also immediately clear what the Primary replica is, as it is marked with the “(P)” sign next to the name of the replica SQL Server, and how the AlwaysOn replicas are configured. Just by looking at the graphical presentation of the AlwaysOn Availability Group, some other detailed information such as whether the replica is regular SQL Server or FCI, is it configured for automatic or manual failover or to what connection mode replica is set can be seen.
The health status of AlwaysOn is represented with the
 icon and is marked by different colors to communicate the health of those for each replica. For more details about how to interpret the graphical presentation of AlwaysOn Availability Groups in ApexSQL Monitor, please refer to Monitoring AlwaysOn Availability Group
For some detailed information and data about monitored AlwaysOn Availability Groups, there is a tabular view below the graphical presentation. The grouped tables cover detailed information about: WSFC (Windows Server Failover Cluster), WSFC members, Availability Groups, listeners, Replicas on <AG name>, and Databases on <replica name>
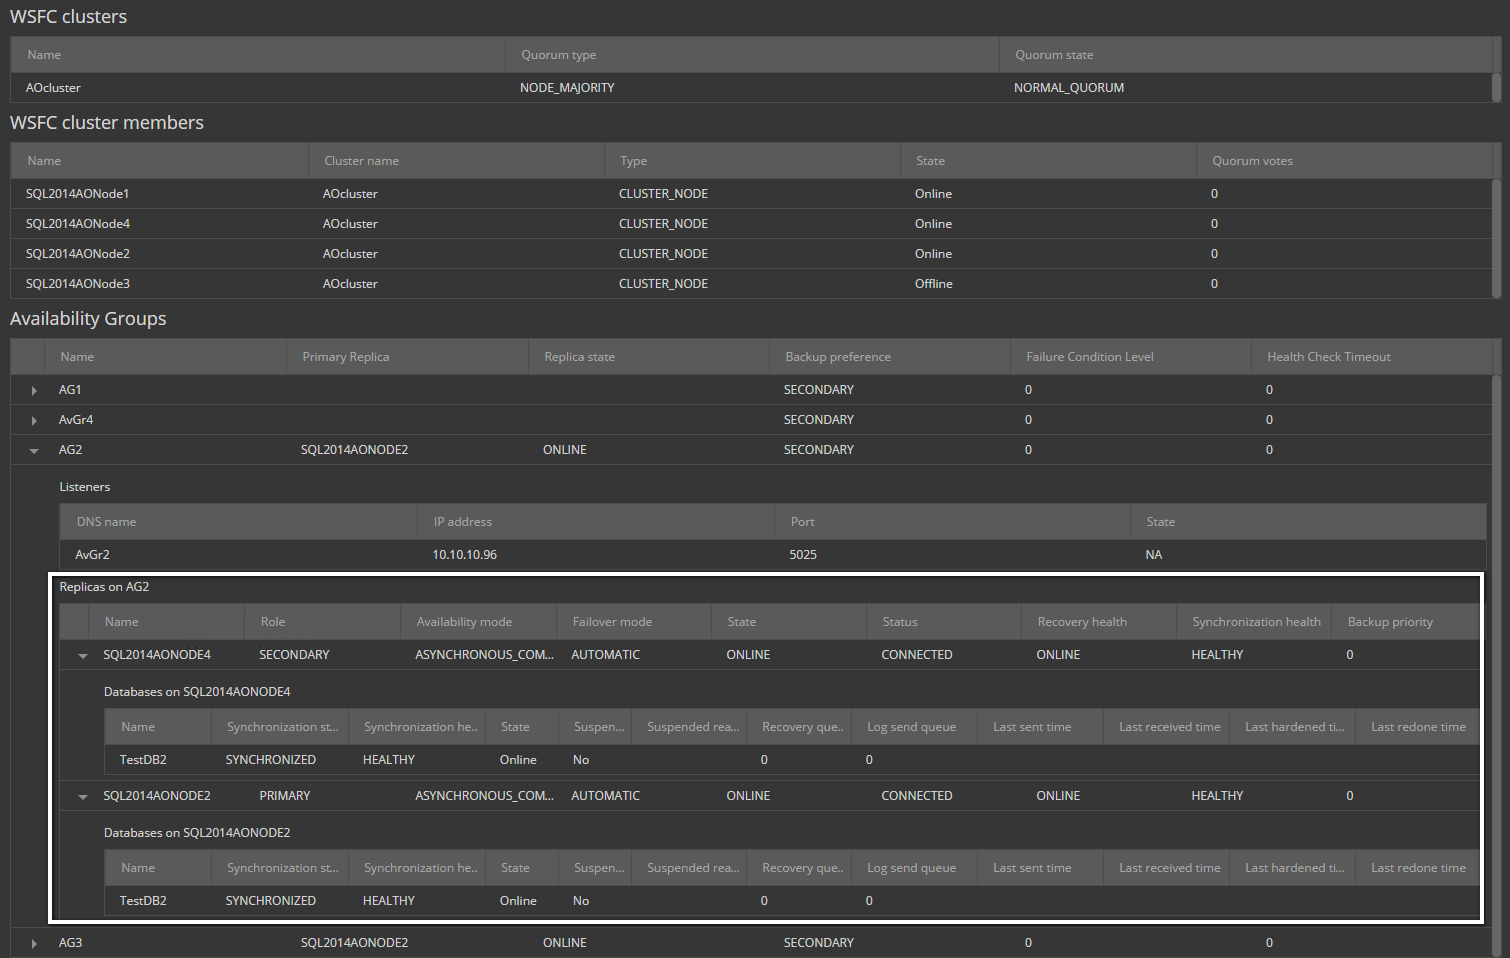
There is a lot of relevant information exposed in these grids and in addition and most of the grids are expandable in order to allow the user to drill down and expose additional details. For example, it is easy to see what databases are hosted by the AlwaysOn Availability Group as well as where those databases are hosted (which replica is hosting which database) and all relevant information for those databases
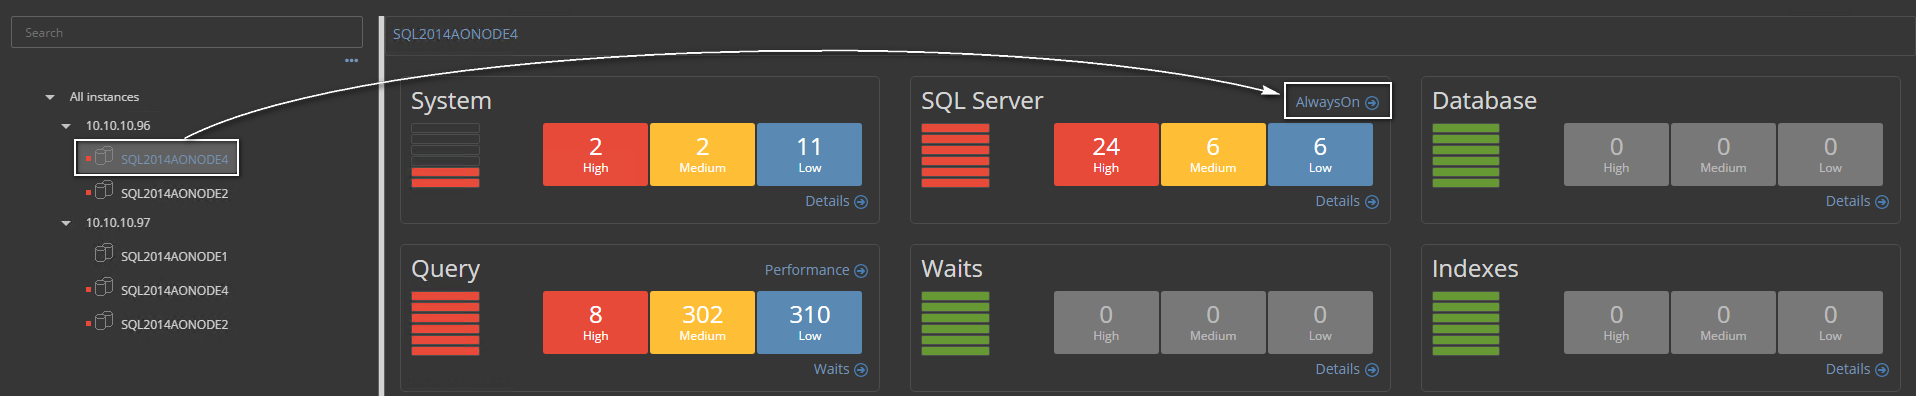
For those who want to track the AlwaysOn Availability Group performance in real time via set of counters dedicated to AlwaysOn performance monitoring, but also by ability to analyze the historical data, ApexSQL Monitor provides charts for all important AlwaysOn counters. Selecting the replica in the tree-view and the AlwaysOn link in the SQL Server section of the instance dashboard will open the AlwaysOn Charts screen
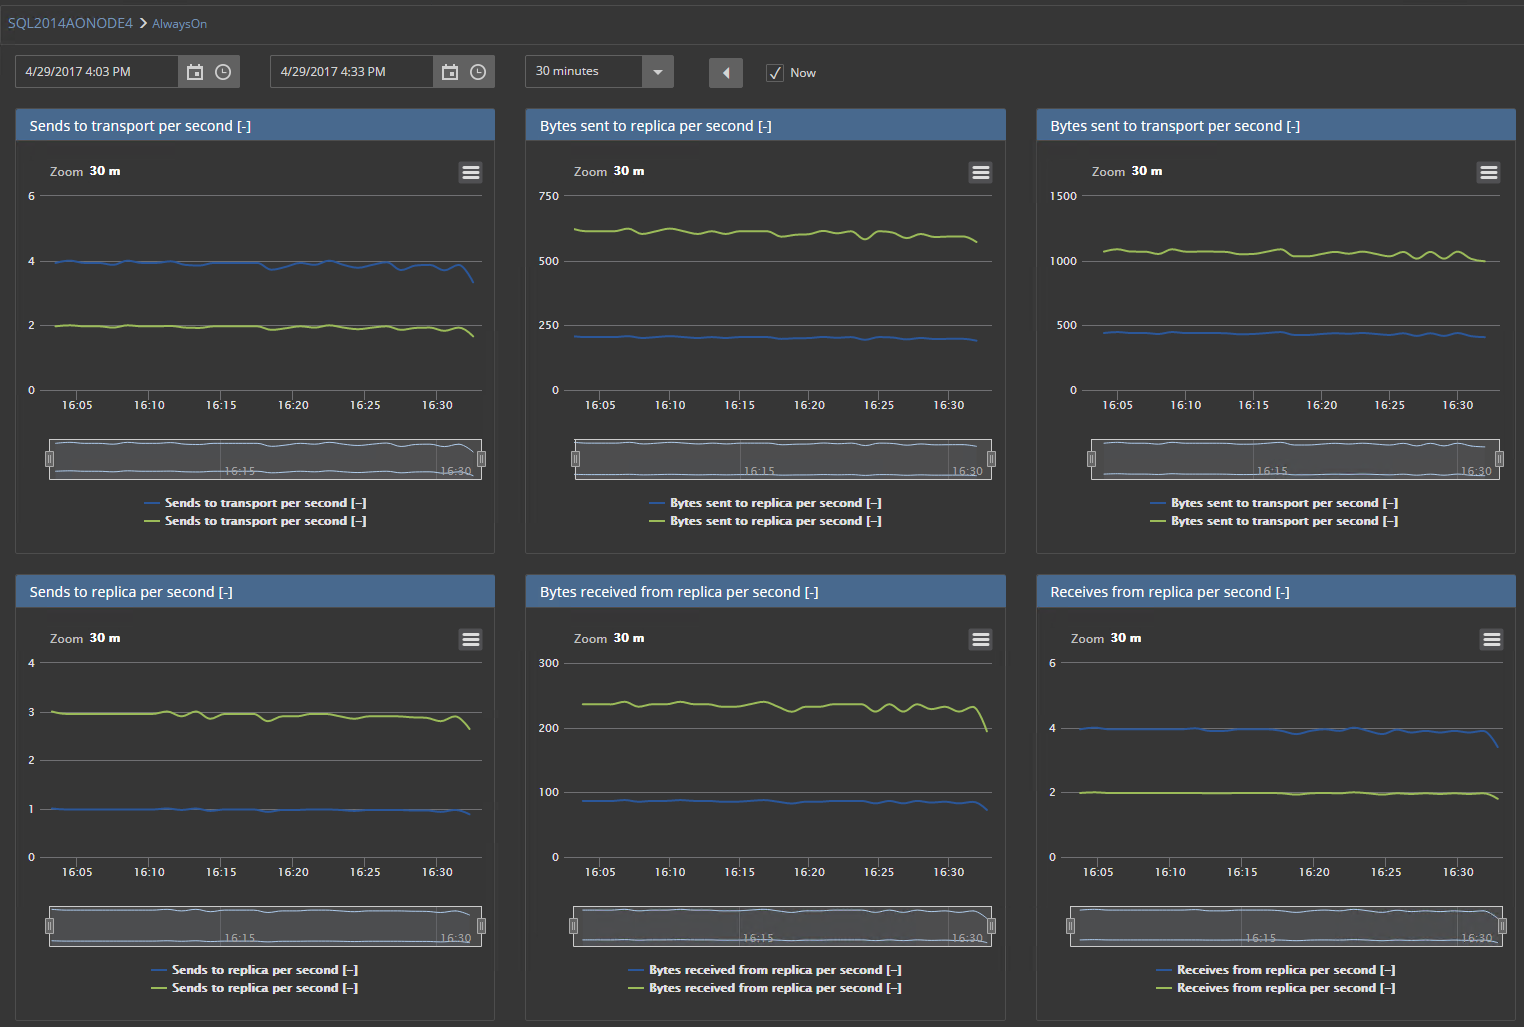
Below is a list of six AlwaysOn Availability Group counters (with a brief description of each) that can be monitored in real time via ApexSQL Monitor:
Sends to transport per second – Displays the number of AlwaysOn Availability Group messages sent to a replica. For the primary replica it will display the number of messages sent to secondary replica, while for secondary replica it will show the number of messages sent to primary replica
Bytes sent to replica per second – Displays amount of bytes sent to another availability replica in one second. In case it is the primary replica, this counter will display the amount of data in bytes sent to the secondary availability replica. For the secondary replica, this counter will display the amount if data sent from the secondary to the primary replica
Bytes sent to transport per second – Displays the total amount of bytes sent to the replica(s) over the network. This counter is usually a bit higher than Bytes sent to replica per second as this number is actually the real amount of bytes sent through the network
Sends to replica per second - Displays the number of AlwaysOn Availability Group messages sends to replica
Bytes received from replica per second – Displays amount of bytes received from another availability replica in one second. This also includes the status updates and pinging, so some traffic will be present even for databases without any user activity
Receives from replica per second – Displays the number of AlwaysOn Availability Group messages received per second, from another replica
With AlwaysOn it is sometimes informative to determine the “density” of data that are circulating between the replicas. Since all data are sent via messages, it should be fairly easy to recalculate the density e.g. the amount of data that will be sent with each message per second
So let’s see an example:
Bytes sent to replica per second total value is 2,600 KB/sec
Sends to replica per second total value is 163
Use the simple calculation Bytes sent to replica per second/Sends to replica per second
The calculated number will show the average number of bytes that is sent in each message (in each send to replica) and in this particular example it is ~16KB
In addition to this, ApexSQL Monitor has built-in alerting for various health and failover changes. ApexSQL Monitor offers a fully configurable alerting system which includes the ability to predefine alert thresholds for AlwaysOn counters as well as ability to use baseline calculation and alerting to calculated baseline thresholds (statistical deviations) values
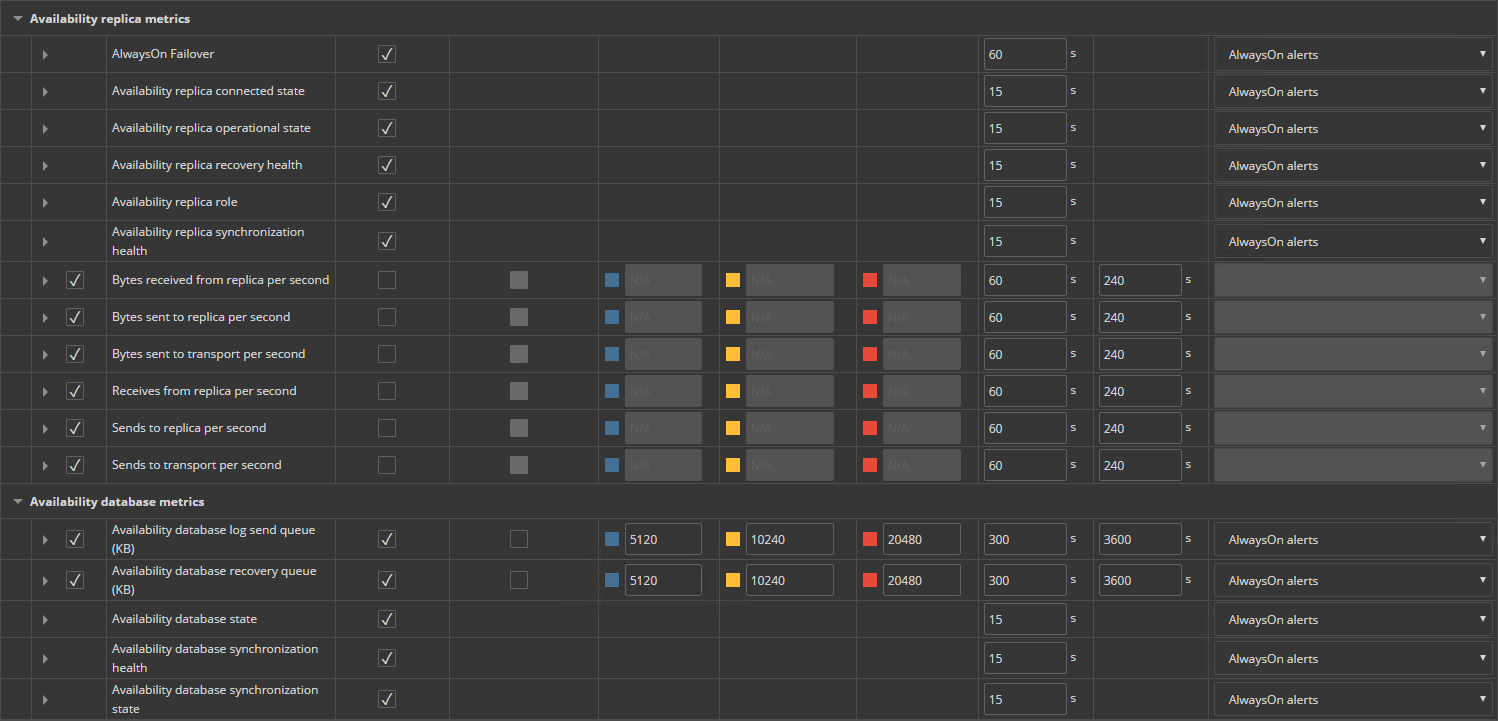
For each AlwaysOn metric it is also possible to send notifications via email, or to execute a user defined action. Example user defined action might be a specific CLI command, T-SQL script or SNMP trap