-
Title
Using the MongoDB Server Overview and MongoDB Databases dashboards -
Description
What do the MongoDB Server Overview and MongoDB Databases dashboards display? -
Resolution
Server Overview
This dashboard provides a comprehensive view of the MongoDB Server, Network, and Host metrics. Operators can hover over titles and the dashboard will display the current state and any associated alarms. The Server Navigation Bar at top can be used to navigate to other pages containing more detailed information on this server. Also, the MongoDB Server Selector link in the action panel on the right of the screen exists for all pages at this level, allowing you to switch between servers without returning to the MongoDB Servers dashboard.

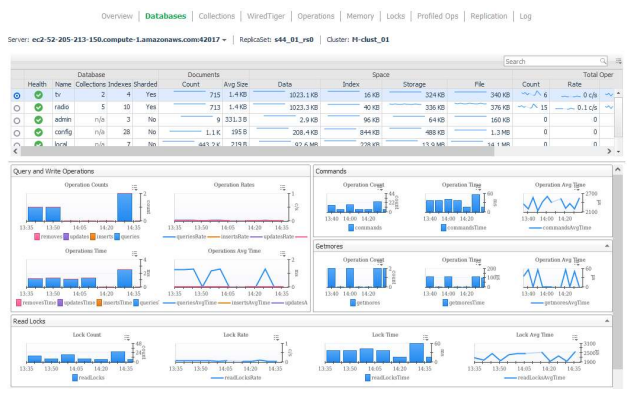
Databases
The Databases dashboard lists all non-system databases for the server, along with key information. Choosing a row will update the bottom section to show Operation statistics for the selected database. Clicking a value in the Collections column will drill down to the Collections page for this server with only the collections for the database row shown by default.