
-
Título
Top things you need in a SQL Server performance monitoring tool (from deadlocks monitoring to alerting and index monitoring) -
Resolución
The initial article, Top things you need in a SQL Server performance monitoring tool (from performance metrics to wait statistic and query performance monitoring) covers the most important “things” that any DBA expects to find in an SQL Server performance monitoring application and how those are covered in ApexSQL Monitor. This sequel will cover another set of critical and essential information that any successful SQL Server performance monitoring tool should be able to monitor and present in a manner that is easy to understand and interpret, and how those are covered in ApexSQL Monitor
So, besides the features described in the previous article, the following set of features that are equally important with the ones previously described will be covered:
- SQL Deadlocks detection
- Baselining
- Alerting
- Index monitoring and maintenance
Deadlocks
SQL deadlocks are always a bad thing when they occur in SQL Server. Deadlocks are a specific type of blocking where two or more processes block each other, and they cannot continue with the execution until SQL Server steps in and decide to kill the processes until it ensures that the situation where resolved. The processes that are killed while resolving the deadlock by SQL Server are “victims” in proper SQL Server terminology.
Regarding SQL Server performance, a deadlock is a substantial operation for SQL Server as it requires some time and extensive processing first to detect a situation where deadlock occurred, then to process the queries involved and decide which one should be terminated, or in which order if three or more queries are involved in a deadlock, to roll back all changes made by the queries that were chosen to be the victims, and if possible to perform the victimized operation again. Besides that, the consequence of SQL deadlocks is that the end user was left in a situation that his actions didn’t give any results as processes that were chosen as victims couldn’t complete the work that they intended to complete.
And if the application design or design of the database has some issues that caused the deadlock at the first place, it is highly likely that the deadlock could occur again when the operations that are the victims of the deadlock are restarted, which can end up in a situation that certain operations couldn’t be completed at all
Therefore, the awareness of the deadlock situation and its analysis are crucial and should be treated as a high priority
As for ApexSQL Monitor, all of its performance metrics are highly configurable, and each metric allows for specifying what alert actions should be executed automatically when a critical value is reached. By using the built-in deadlock per second metric, it is possible to monitor the number and frequency of the deadlocks that occur on the monitored SQL Server and to be alerted when that occurs. But for providing detailed information about the deadlocks that occurred on the monitored SQL Server a built-in alert action profile is designed to capture and store details of each and every deadlock when the deadlock alert is triggered. More details on how to correctly configure and use this ApexSQL monitor feature are available in the SQL Server deadlock notifications – Part 2 solution center article, but as quick info, the information about the deadlock is saved as a standard SQL Server .xld file and can be previewed in a graphical form
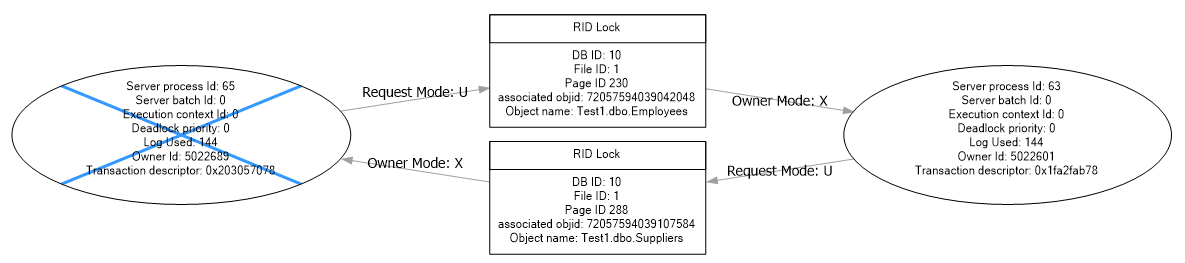
or in the even more detailed textual form using the Microsoft XML Notepad

Baselining
Another feature irreplaceable in any advanced SQL Server performance monitoring and issue analysis process is the ability of the performance monitoring application to calculate the baseline for collected performance data based on its historical values. There are some significant advantages that baselining of SQL Server performance data provides for in many situations over the standard method of predefining alert threshold values when monitoring SQL Server performance. Moreover, monitoring of some fundamental wait types cannot be even done in a proper way without baselining, as it is the only way that allows correct interpretation of collected performance data. Unfortunately, baselining is a complicated job, and even though it can be performed manually, it requires serious experience from a DBA and a significant effort has to be made in order to create it as a sustainable method.
For those who are interested in the baselining basics and how that can be done manually, there is a series of useful articles on that subject that can serve as a good start
- How to detect SQL Server performance issues using baselines – Part 1 – Introduction
- How to detect SQL Server performance issues using baselines – Part 2 – Collecting metrics and reporting
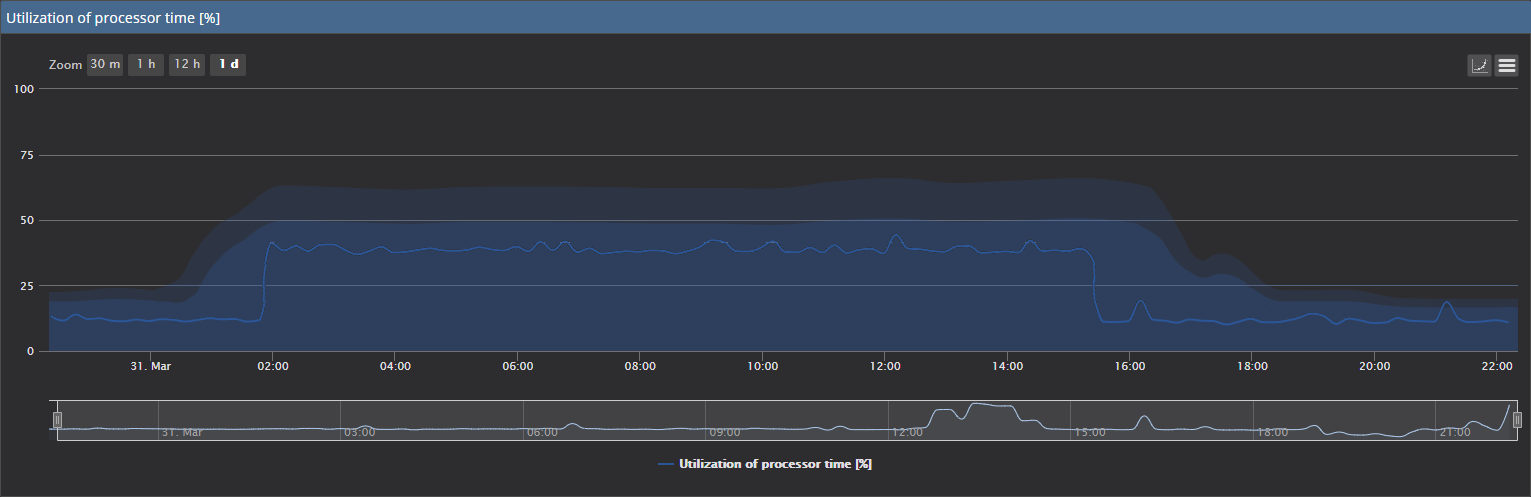
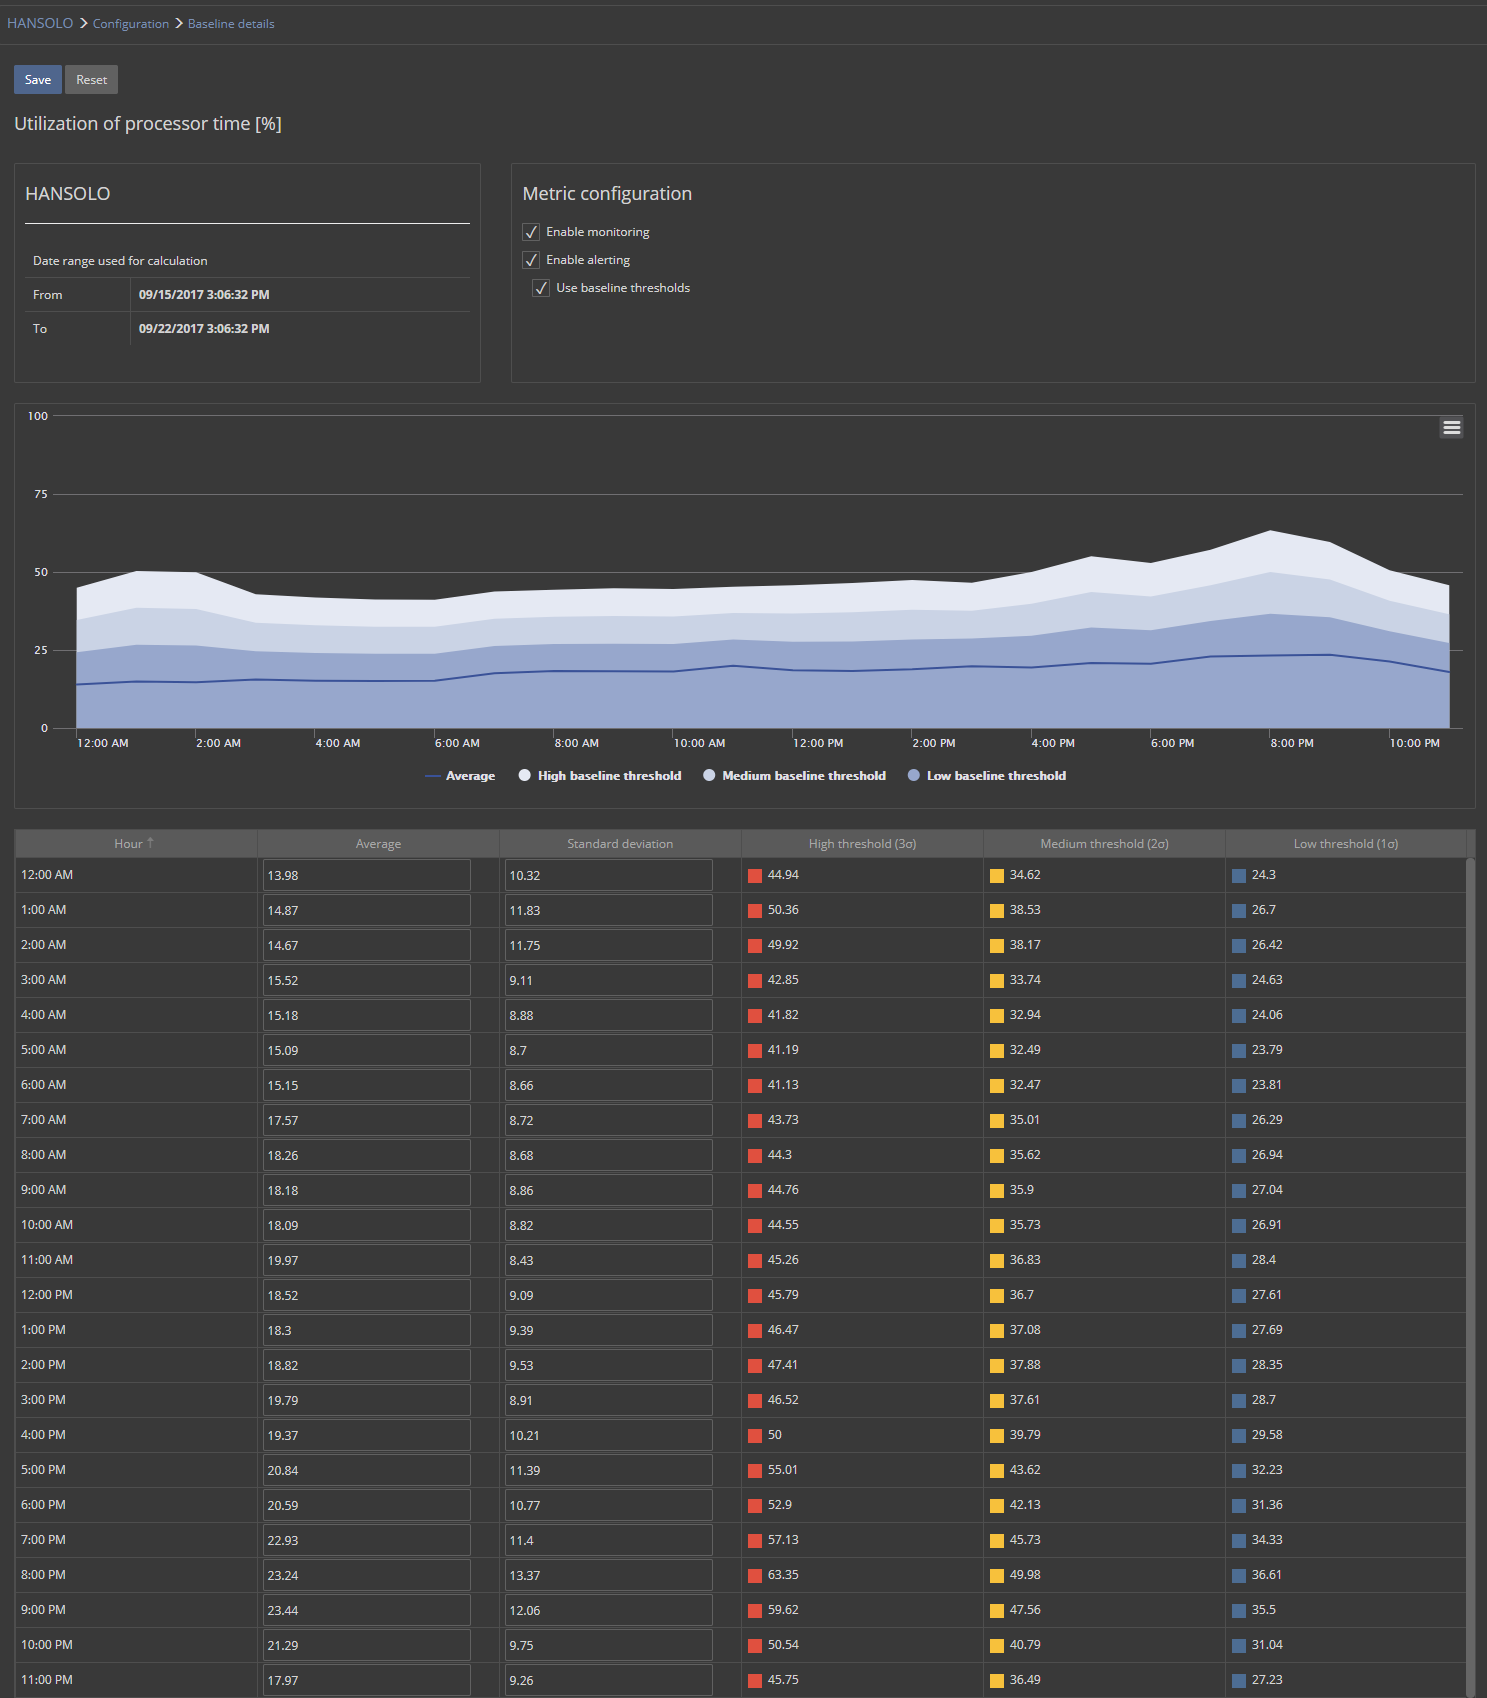
For those who prefer an easier, and more reliable and sustainable baselining ability, baseline-based analysis of performance metrics and alerting can opt for an application such as ApexSQL Monitor. ApexSQL Monitor has built-in ability to calculate a baseline for all SQL Server performance metrics which also includes calculating baselines for wait statistic data per monitored wait type. This solution also considers the ability to calculate standard deviations used as a basis for alerts thresholds calculation. For accurate calculation of standard deviations, ApexSQL Monitor uses the highly sophisticated Welford’s calculation method. On top of that, ApexSQL Monitor can convey the calculated baseline values and thresholds graphically in ApexSQL Monitor charts directly
To learn more about how to properly use and interpret the baseline in performance monitoring can read the following articles:
- How to detect SQL Server performance issues using baselines – Part 3
- How to master SQL Server performance baselining to avoid false positives and/or missing alerts
Besides the ability to calculate the baseline, ApexSQL Monitor has the ability to fine tune already calculated baselines. The application even allows calculating baselines using historical data for a considerable period of times (limited only with the applied data retention policy), there might still be a need for manually smoothing out data spikes, various statistical outliers, and incongruities that might cause the inaccurate perception of historical data and thus inaccurate alerting.
To learn how to fine-tune calculated baseline and about baseline calculation internals see
- How to customize the calculated SQL Server baseline threshold
- How to calculate a baseline for less than seven days of historical data
Alerting
Perhaps the most sought-after feature that separates basic and advanced SQL Server performance monitoring tools, and at the same time may be trickiest one to set up and use in a proper way, is the ability of performance monitoring tool to alert and notify the user about potential and existing performance issues. While performance monitoring of the SQL Server and the underlying system is necessary, it is not enough. The ability to trigger an alert and notify the user to make them aware of any important performance change that is out of the boundaries of what is considered to be the “normal” SQL Server performance, is a critical component of any performance monitoring solution.
ApexSQL monitor alerts are designed to inform the DBA in real time on probable and current issues with Windows and SQL Server instance performance. They are optimized to allow a highly granular configuring up to the individual device and database per monitored performance metric.
By default, ApexSQL Monitor uses alerting that is based on the three predefined alert threshold levels (where applicable): high, medium, and low. For distinguishing the various threshold levels in a straightforward manner, alerts are congregated into three severity-based categories where alert severities are indicated using three different colors: Red for high, Yellow for medium, and blue for low. The default color for the OK state is green
ApexSQL Monitor has an effective mechanism to fight against one of the most significant problems DBAs often face – excessive alerting. As it is entirely reasonable for some metrics to have spikes or to exceed predefined alert thresholds for shortly, the alerts that such behavior could generate is in most cases unnecessary and unwanted and is designated as false positives. The problem with false positive alerts is even more pronounced for high metric reading frequency or while monitoring a large number of SQL Server instances. ApexSQL Monitor utilizes an effective mechanism for suppressing the false positive alerts via the Alert period functionality. ApexSQL Monitor utilizes the alert period as the granted amount of time where all consecutive metric values returned within that alert period must be above the predefined threshold for an alert to be triggered. The Alert period is configurable via the metric configuration page


The Alert period feature could look quite complicated at the first look, but once it is mastered, it appears as entirely natural and logical.
For detailed information on how to properly use and master this vital feature, check the article:
How to suppress excessive alerting using Alert periods

Quick tip:
Another problem, the opposite of the aforementioned issue with excessive alerts, is to have ApexSQL Monitor with under configured alerts. Insufficient and/or limited alerts don’t deliver enough information for noticing or pinpointing the problem, which leads to delayed DBA reaction or in a worst case, no actions at all. The issues may remain unnoticed, and it could often be too late for some proper damage control actions.
To guard against this, you should proactively audit your system for any missing alerts. If the system or SQL Server experience issues but alerts are not raised, analyze the system and/or SQL Server and set the appropriate alert thresholds to address the existing issues that are real indicators of urgent problems
One important suggestion when monitoring SQL Server is “Don’t stick to a single threshold value.” The predefined threshold values in ApexSQL Monitor are based on some best practice or rule of thumb, but it should not be treated anyhow as a definite and the best value for every monitored system. It is also not unusual that DBAs stick to some Microsoft threshold recommendations established five, ten or even more years before, without taking in consideration that system requirements and hardware were significantly different back then.
Following such “popular” thresholds blindly for a production system could definitely lead to situations when critical alerts rise one after another, and there is no meaningful action that can be taken simply because the system is working flawlessly. Or worse, having the complete “silence” while the system is struggling to fulfill user requirements. Saying that, it is important that each DBA tailor each threshold relative to the system they are working on. Using previously described ApexSQL monitor baselining ability can overcome efficiently such problems in many cases.
ApexSQL Monitor provides information about the alerts status on the two essential pages the group dashboard and instance dashboard. While the first one gives a quick insight into consolidated alerting information for multiple monitored SQL Servers that are part of the selected group.

On the other hand, the instance dashboard provides more detailed insight into raised alerts on a specific SQL Server instance.

By accessing the alert page via the Alerts link in the main menu, the information about raised alerts will be displayed
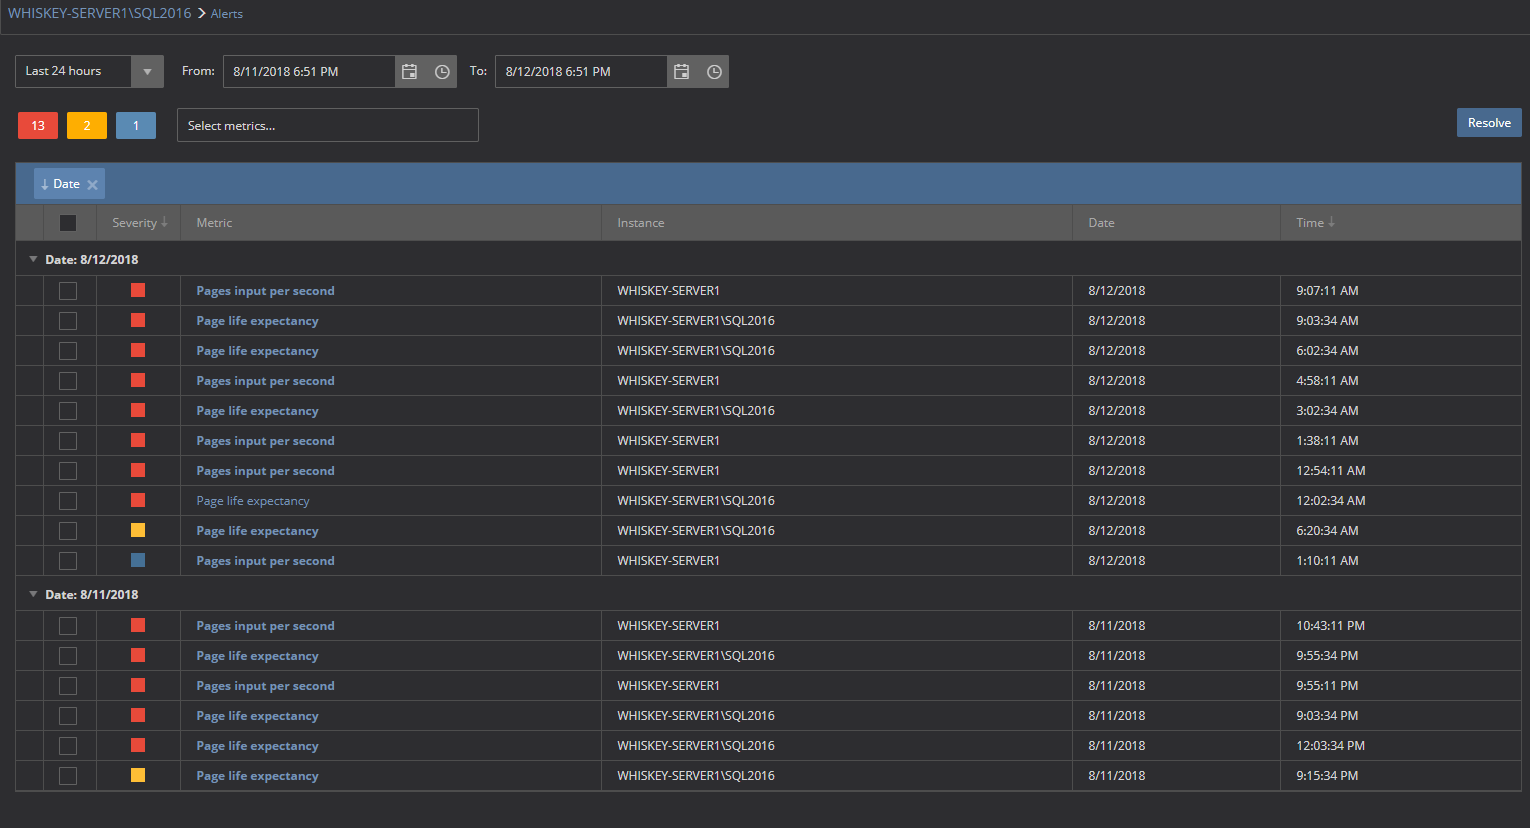
Click on the alert name link will drill down to details of that particular alert

Besides displaying the chart for a specific time frame when the alert is triggered for the given performance metric, ApexSQL Monitor will analyze other metrics in the same period of time to find any anomalies in values, such as a sudden increase or decrease of metric values or any other kind of erratic behavior in that period. That should provide a better insight in the triggered alert as It could be quickly inspected whether the alert is the consequence of some other performance metric or the metric that triggered alerts affected some other metric as well. Having a more complete insight into all potential issues and consequences should significantly help in making a decision when it comes to troubleshooting and alert resolution
More about how to set up and use the ApexSQL Monitor alerting ability can be seen below:
- ApexSQL Monitor alerts
- How to create and schedule maintenance periods in ApexSQL Monitor
- How to suppress excessive alerting using Alert periods
- Resolving alerts in ApexSQL Monitor
The ApexSQL Monitor alerting system also considers the ability for the user to be notified about alerts via email or SNMP trap, or to use application advanced ability to execute its own T-SQL script or command.
For more information on how to do that see more articles below:
- Working with email notifications and email profiles in ApexSQL Monitor
- How to use custom SQL script alerts in ApexSQL Monitor
- How to use custom command alert actions in ApexSQL Monitor
- Configuring and setting up the SNMP trap in ApexSQL Monitor
- How to set up SMS alert notifications in ApexSQL Monitor
Indexes
SQL Server indexes are probably one of the most controversial parts of SQL performance tuning. The SQL Server index is a critical component of SQL Server that can significantly influence SQL Server performance, but at the same time, used improperly, it can severely degrade the system performance.
Therefore, establishing the discipline of regular index maintenance, and as such index monitoring as well is an essential task. ApexSQL Monitor ships with a set of SQL Server index monitoring metrics, and it can provide all the essential data about the monitored indexes
Managing indexes requires some extensive knowledge, so for those with less experience reading some useful articles prior to starting dealing more severely with index management and monitoring such as
- How to identify and monitor unused indexes in SQL Server
- and also Ahmad Yaseen’s series about SQL Server indexes found here: SQL Server indexes – series intro
While ApexSQL Monitor is the tool primarily designed to monitor index performance via collecting performance data, for more focused and applied SQL Server index management and maintenance, ApexSQL has introduced another dedicated tool ApexSQL Defrag, which can be used as a supplement to ApexSQL Monitor. ApexSQL Defrag allows significant automation of the index management and maintenance process but also provides the user ability to meet its specific requirements via the ability to create and manage various custom policies
Index monitoring could be a performance intensive operation, and it could cause the overhead on the monitored server, and therefore it is not enabled by default. If index monitoring is needed, it must be enabled in the index configuration page.

Quick tip:
Be careful when setting the minimal size condition for indexes that should be monitored. 5 MB size is set for the purpose of easier evaluation, but for production servers that value should be increased to at least 20 MB. It is highly unlikely that smaller indexes could cause any sort of issues on large production servers
The Indexes page uses a table to list the indexes that meet the configured criteria and essential information about each listed index such as a table, database, type, whether it is a unique index, is it set on the primary key and finally the size info.

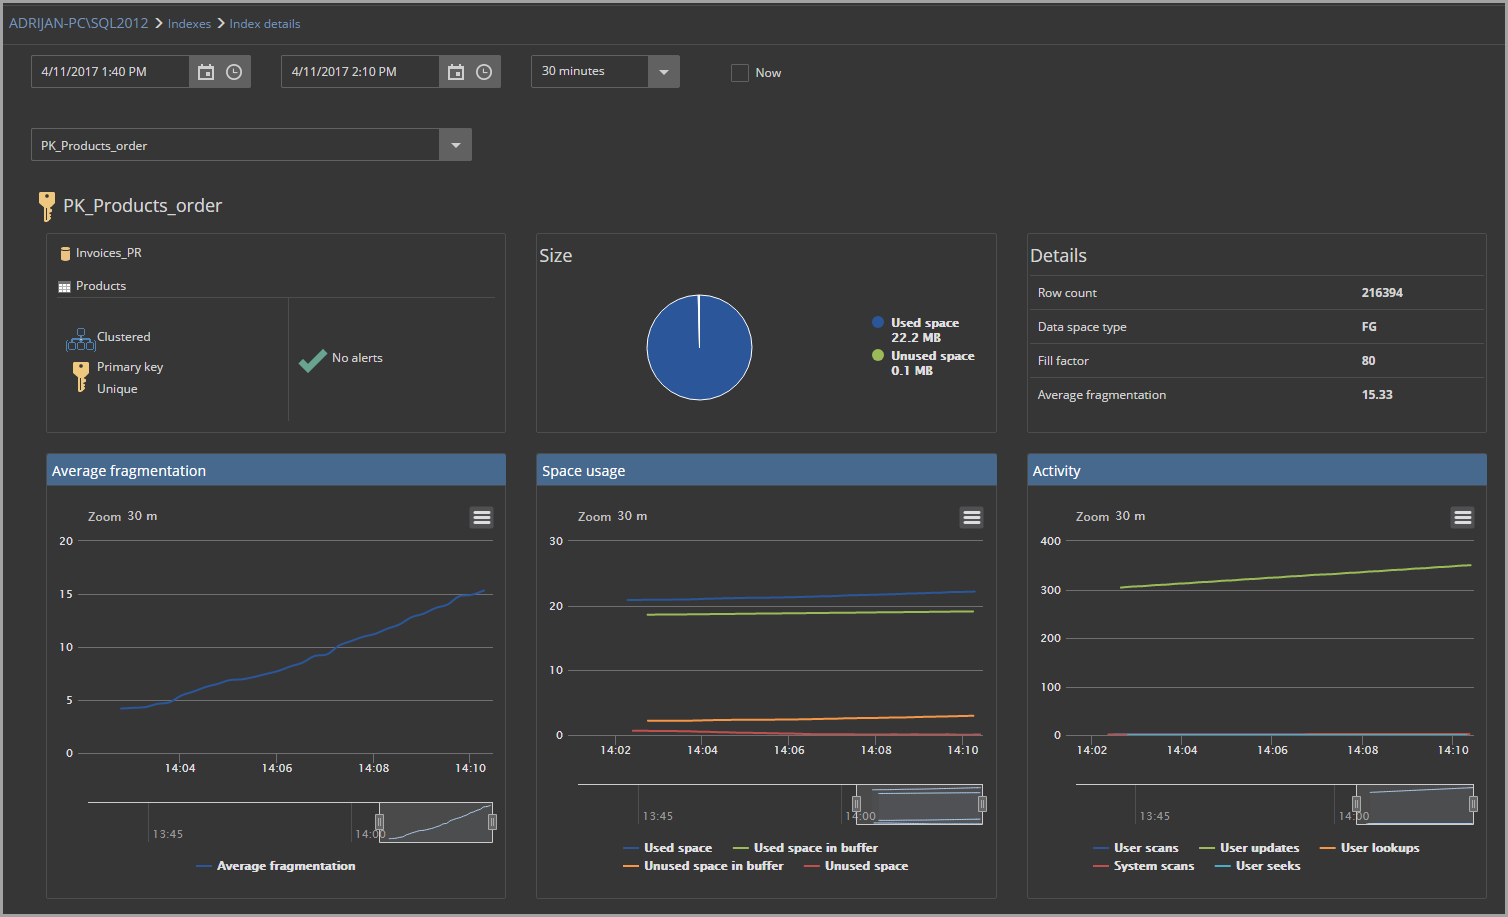
Detailed information about specific index can be obtained by drilling down via the index name link. It opens the page with details for the specific index with Average fragmentation, Space usage, and Activity charts and detailed index info. Reviewing details of another index can be done fast without leaving the page via the drop-down menu
To become more familiar with ApexSQL Monitor ability for index monitoring, check the following articles: