
Variations in Activity Data
Variations in Site Usage Data
Typically, ControlPoint activity analysis data (including Farm Summary and Top Sites) is based on daily request data compiled by SharePoint.
At the site level, this data is normally presented various Usage and Search reports.
You can link directly to the applicable page for your SharePoint environment from ControlPoint Activity Analysis results.
Depending on a number of factors, including the SharePoint variation that you are running and which features are activated in a particular site collection or site, the SharePoint site usage report data may be different from either of those shown in the example above.
For analyses that report cumulative monthly activity, data is collected from the SharePoint Search Service.
Analyzing Site Collection Activity
The Site Collection Activity Analysis provides activity statistics for selected site collections, including:
·the distribution of activity among Web applications andsite collections selected for analysis, and
·the number of top site collections (that is, site collections within the scope of your analysis with the most activity).
Site Collection Activity analyses use cached data collected by ControlPoint Discovery. .
1Choose Activity > Site Collection Activity Analysis.
2Specify the parameters for your analysis.
Note that, in addition to the "standard" parameters:
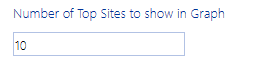
§A Number of Top Sites to show in Graph must be specified. The value in this field (which is 10 by default, but may be changed) represents the number of site collections with the most activity that you want to examine more closely. These sites are listed in a separate section at the bottom of the analysis Results section.

NOTE: If you want to perform an analysis that focuses exclusively on top site collections that meet specific activity or storage criteria, you can generate a Most/Least Activity Analysis.
Now you can:
·run the operation immediately (by clicking the [Run Now] button)
OR
·schedule the operation to run at a later time or on a recurring basis.
OR
·save the operation as XML Instructions that can be run at a later time.
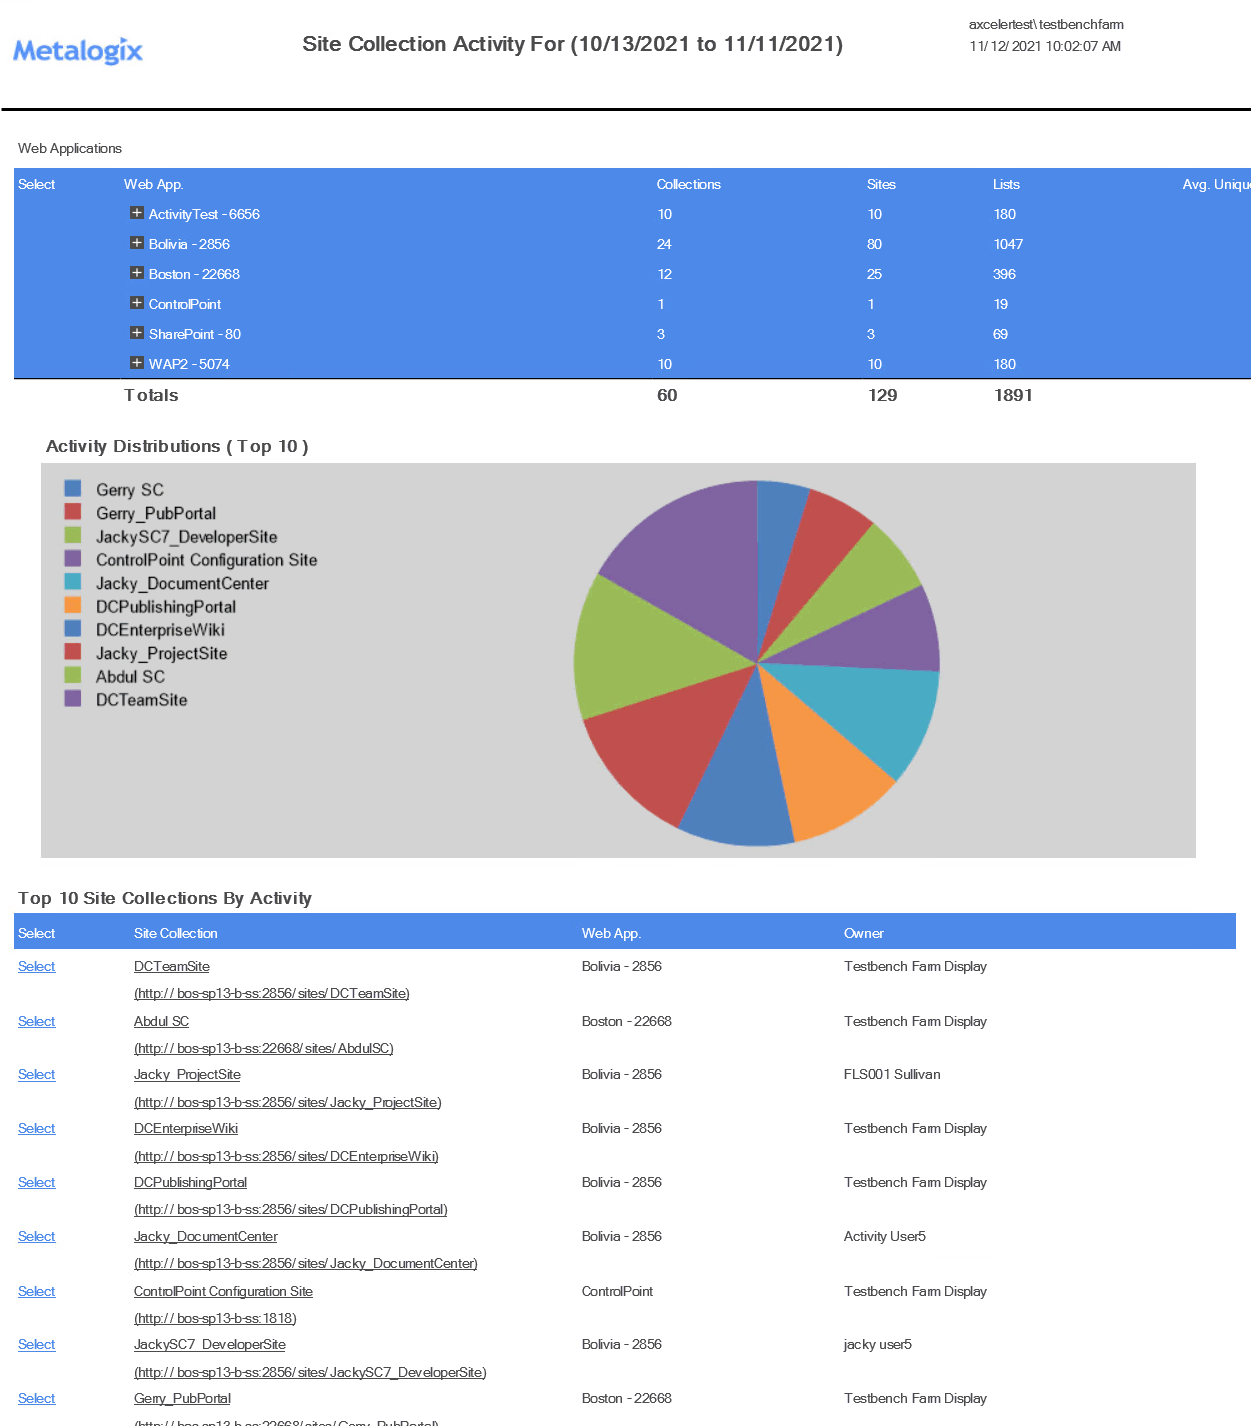
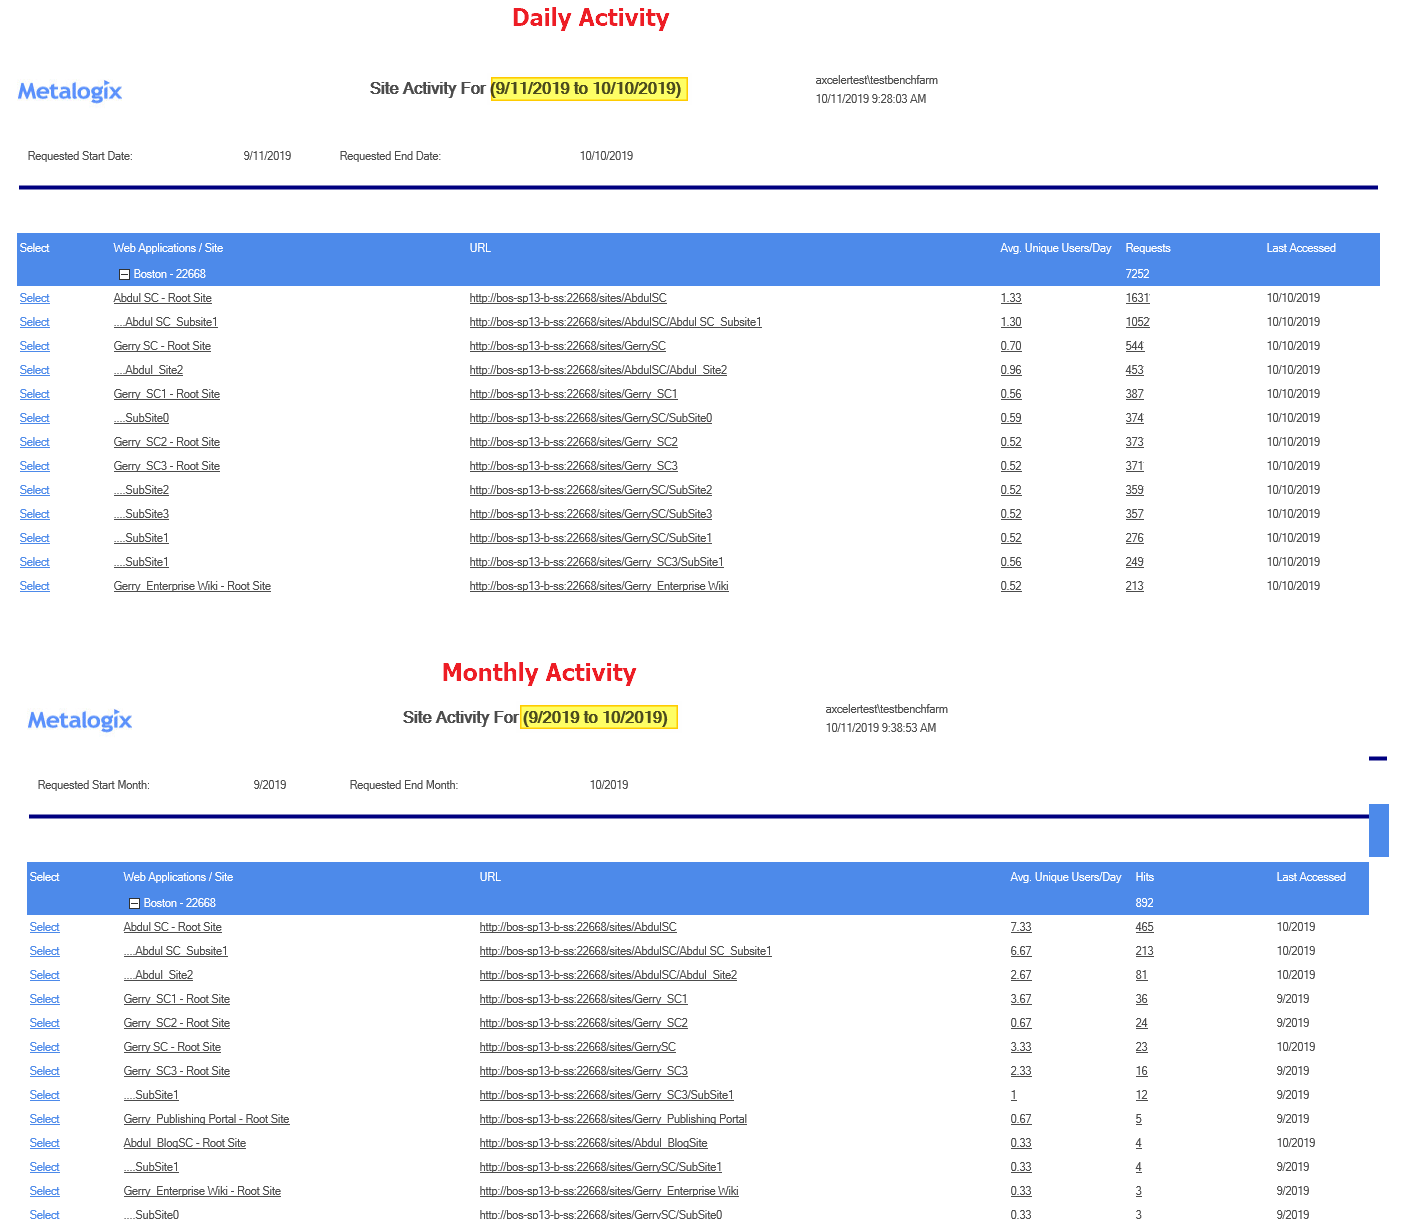
The Activity Report displays the following sections:
§Web Applications
§Activity Distribution
§Top Site Collections
Web Applications Section
The Web Applications section lists all of the Web applications within the scope of your analysis, along with the following statistics for individual Web applications, as well as cumulative totals:
§the number of Collections, Sites, and Lists in each Web application
NOTE: The number of Lists includes both user-created (visible) lists and internal (hidden) lists, such as galleries, that are necessary for the functioning of the site. for the specified day or time period.
When expanded, statistics for individual site collections within each Web application displays, including:
·the site collection name (with a hyperlink for generating a ControlPoint Site Activity analysis for the selected site collection/time period.)and url
·the number of Sites and Lists within the collection
· the Avg. Unique Users/Day who have visited the site collection for the specified day or time period (That is, any user who has more than one set of permissions to a site is only counted once.)
·the number of Requests that the site collection has received for the specified day or time period.
·the date when the site collection was Last Accessed (within the date range specified by the analysis).
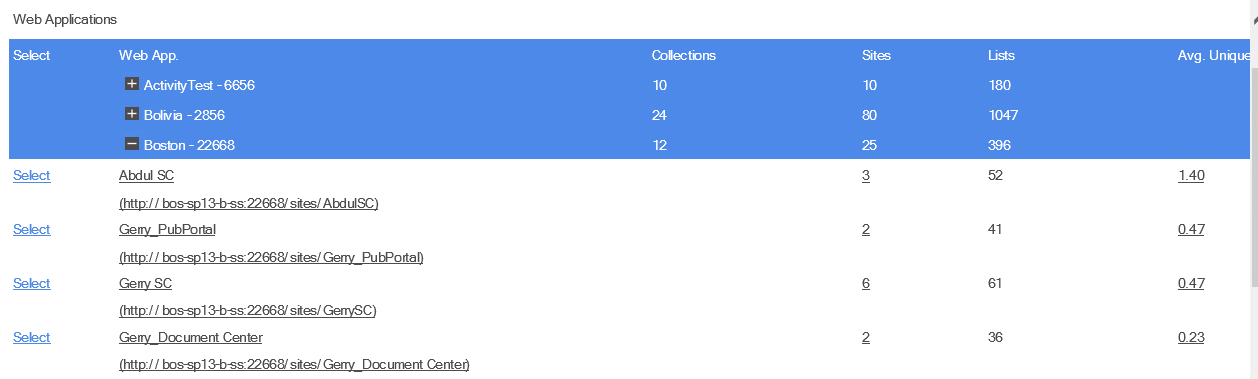
Some statistics are hyperlinked to relevant SharePoint pages for Usage.
Activity Distribution Section
The Activity Distribution section consists of a pie chart that depicts the distribution of activity among the Web applications returned by your analysis.
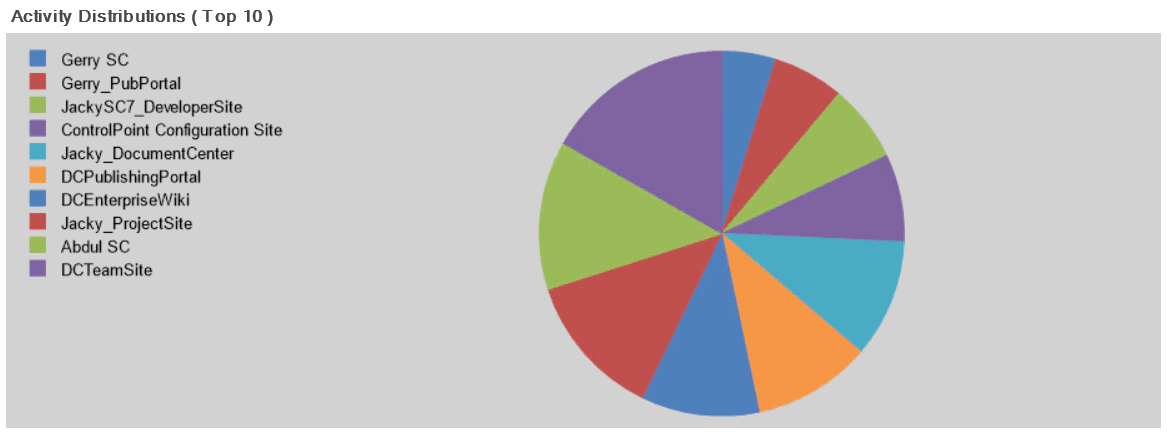
NOTE: If the analysis was generated for a single Web application, the pie chart will show the distribution of activity among site collections within that Web application.
Top Site Collections Section
This section shows statistics for the site collections within the scope of your analysis with the most activity. The number of site collections that displays in this section is determined by the value you entered in the Parameters section for Limit Display to.
NOTE: The Last Accessed date shows the last time the site collection was accessed within the date range covered by the analysis. Any activity that occurred before or after the specified date range will not be reflected in results.
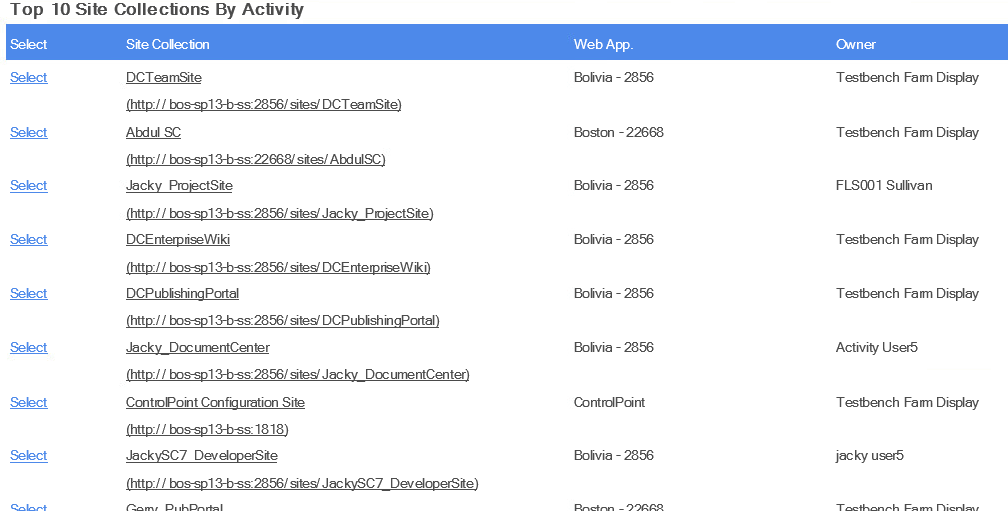
Note that any site collections that have been deleted since ControlPoint Discovery began collecting data will display at the top of results, along with the word "Deleted."

See also Analyzing Most/Least Activity.
Analyzing Site Activity
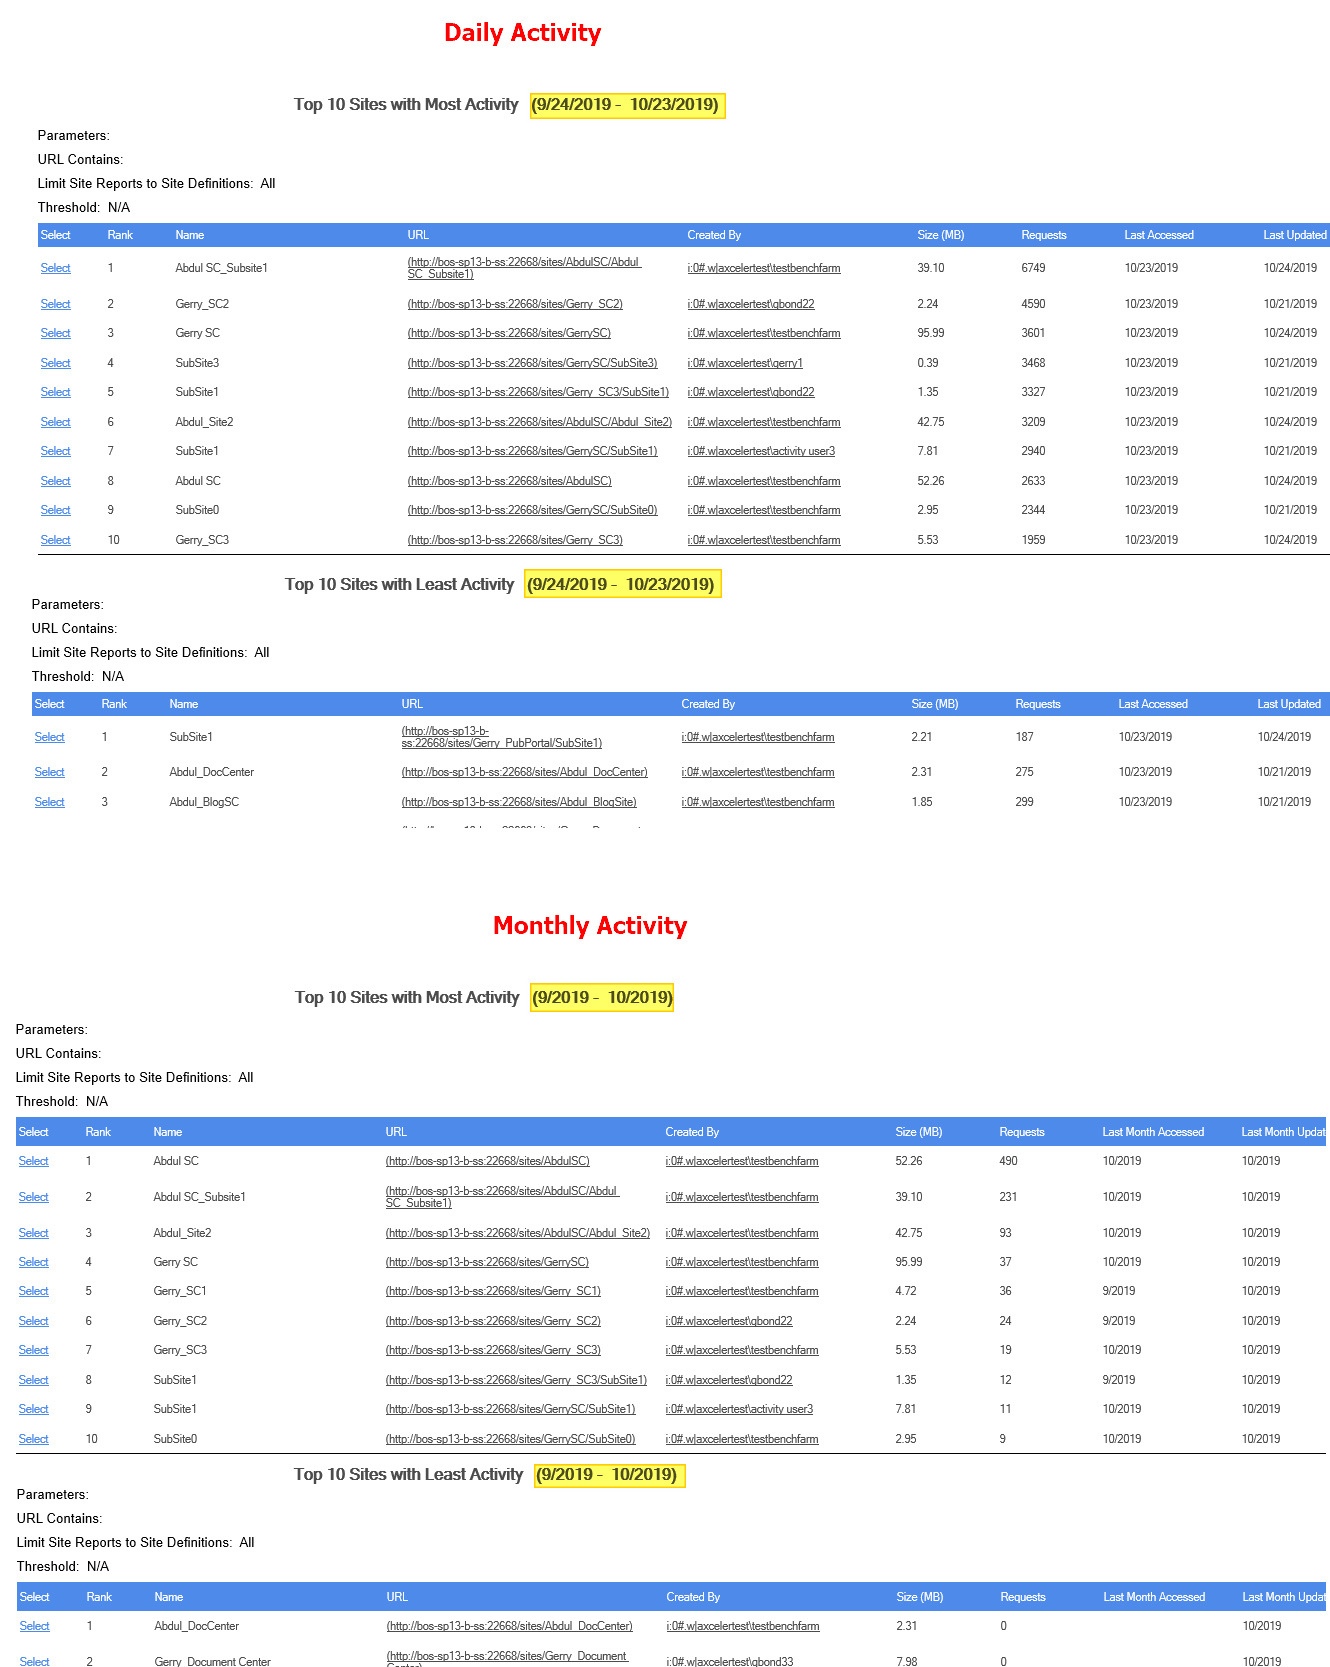
The Site Activity Analysis provides activity statistics for one or more selected sites, including the distribution of activity among sites within the scope of your analysis. You can report daily activity, which uses data from the SharePoint Usage database as well as monthly activity from the SharePoint Search Service.
To generate a Site Activity Analysis:
1Select the object(s) for which you want to analyze site activity.
2Choose Activity > Site Activity Analysis.
3Select either Show Daily Activity or Show Cumulative Monthly Activity.

4Specify additional parameters for your analysis.
Note that, in addition to the "standard" parameters, Number of Top Sites to show in Graph must be specified. The value in this field (which is 10 by default, but may be changed) represents the number of pages with the most activity that you want to compare graphically (in the form of a pie chart).
The Site Activity Analysis displays the following sections:
·site collections and sites
·Activity Distribution
Site Collections and Sites Section
The site collections and sites section lists the sites within the scope of your analysis, along with the following statistics for the specified day or time period:
·each site and subsite within the scope of your selection
·the site URL
·the Avg. Unique Users/Day
·total Requests (for daily activity) or cumulative Hits (for monthly activity)
·the date or month when the site was Last Accessed.
NOTE: For Daily activity, the Last Accessed date shows the last day the site was accessed within the date range covered by the analysis. For Monthly activity, the Last Accessed date shows the last month the site was accessedas far back as the earliest month in the SharePoint Search Services databaseregardless of the date range covered by the analysis.
Note that the indentation of each site and subsite within a site collection reflect the appropriate hierarchical level.
Activity Distribution Section
The Activity Distribution section consists of a pie chart that depicts the distribution of activity among sites within the scope of your analysis.
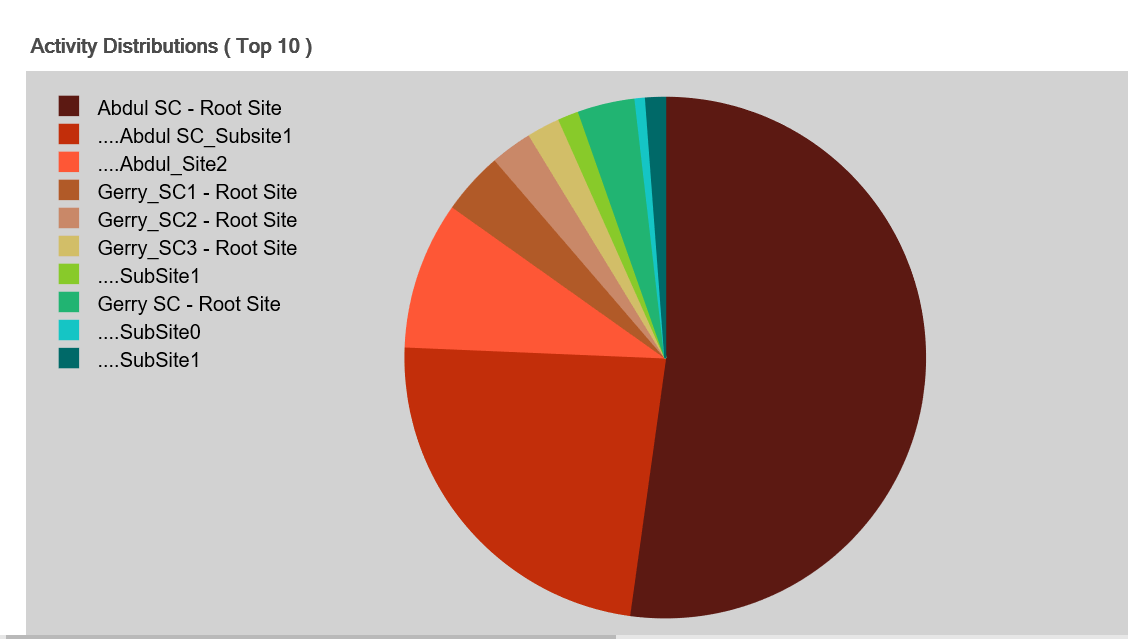
NOTE: If the analysis encompasses only one site, the pie chart will appear solid.
Analyzing Most/Least Activity
Use the ControlPoint Most/Least Activity analysis to examine SharePoint objects within a selected scope and specific date range, ranked according to:
·most or least active site collections and/or sites
·most or least active lists, list items, users, and/or pages.
You can further narrow your result set to include only objects that meet specific criteria and/or thresholds.
NOTE: The SharePoint Search Service is used to collect monthly data (up to 36 months by default but may vary depending on how the Search Service is configured).
To generate a Most/Least Activity analysis:
1Select the object(s) for which you want to analyze most/least activity.
2Choose Activity > Most/Least Activity.
3Specify the following parameters for your analysis:
a)Select the object types you want to analyze:
§Site Collections and Sites
OR
§Documents, Pages, and Users.

Note that remaining parameters are populated based on the object type selected.
b)If you selected Site Collections and Sites, Select either Show Daily Activity or Show Cumulative Monthly Activity
NOTE: If you selected Documents, Pages, and Users, you can only analyze daily activity and this option is unavailable.
c)From the Include Report list box, select the type(s) of activity that you want to include in your analysis.
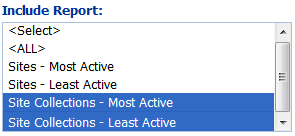
NOTE: If you choose multiple types of activity, each result set will be displayed in a separate subsection.
d)If you want results to cover a time period different than the default date range (for Daily, the past 30 days; for Monthly, from the beginning of the past month up to the current day of the current month), specify a different Start Date and/or End Date.
4If you want to further refine your results, expand the Advanced Options panel.
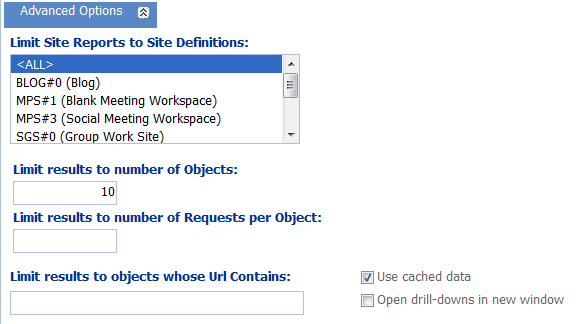
a)If you want to limit your result set to objects that meet one or more specific criteria, use the information in the following table for guidance.
|
If you want to limit each results set... |
Then ... |
|---|---|
|
to objects with one or more specific site definitions (templates) |
select from the Limit Site Reports to Site Definitions list. |
|
to more or less than 10 objects |
change the Limit results to number of Objects default value. NOTE: If this field is blank, the default value (10 objects) will be used. |
|
based on number of requests* |
enter a number for Number of Requests per Object. |
|
to objects whose url contains a specified text string |
enter that string in the Limit results to objects whose URL field. NOTE: If your analysis includes multiple activity types, this limit will apply to each individual result set. |
|
For Documents, Pages, and Users: | |
|
to lists of one or more specific list definitions |
select from the List Definitions list. |
|
to exclude lists that do not display in the site's View all Site Content page |
check the Omit Hidden Lists box. NOTE: If you choose to include hidden lists in analysis results, they are flagged in analysis results with a plus sign (+). |
|
based on number of items in a list* |
enter a number for Limit results to number of List Items per List. |
* NOTE: If your analysis includes "most" activity, results will include objects at or above that limit; for "least" activity, results will include objects at or below that limit.
b)If your analysis includes site collections, you have chosen to show Daily Activity, and you want to use usage data collected directly from SharePoint rather than the ControlPoint cache, uncheck the Use cached data box.
NOTE: Using cached data can significantly reduce the time it takes to generate an analysis on large site collections. Activity at other levels of the hierarchy is always performed in real-time.
Now you can:
·run the operation immediately (by clicking the [Run Now] button)
OR
·schedule the operation to run at a later time or on a recurring basis.
OR
·save the operation as XML Instructions that can be run at a later time.
The body of the analysis includes a subsection for each usage type.
NOTE: For Daily activity, the Last Accessed date shows the last day the site was accessed within the date range covered by the analysis. For Monthly activity, the Last Accessed date shows the last month the site was accessedas far back as the earliest month in the SharePoint Search Services databaseregardless of the date range covered by the analysis.
Site Collections, Sites, or Users with No Activity
Note that if the number of site collections, sites, or users with no activity exceeds the value you specified for Limit Display to, a single line item with the total number with no activity will be returned rather than individual line items.
EXCEPTION: If your analysis includes Site Collections -Least Active and is run using cached (not realtime) data, results will show only site collections with the least amount of actual activity (site collections with no activity will not be included).
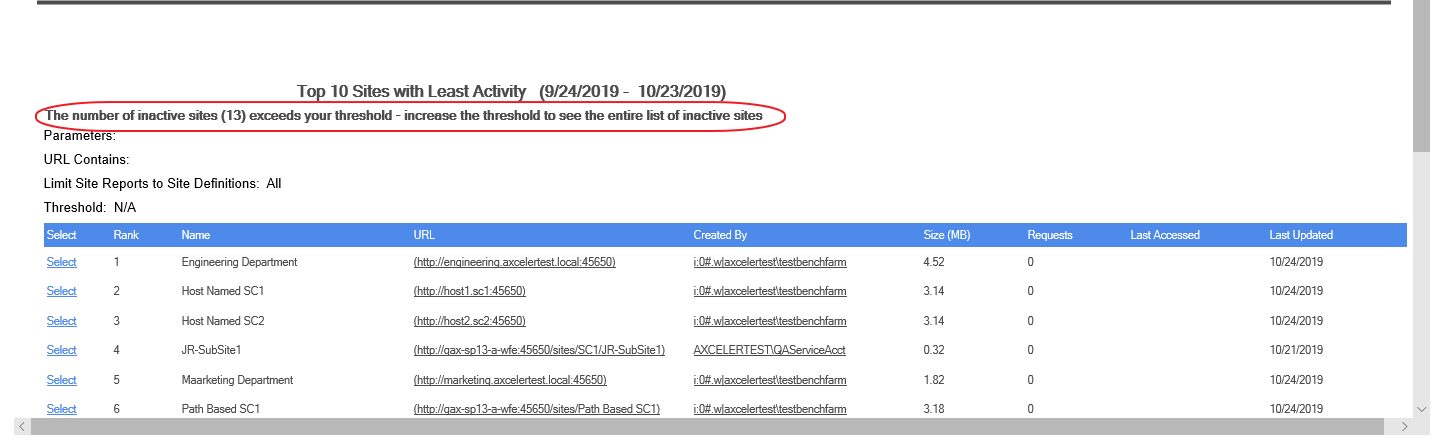
TIP: If you want to see all of the site collections, sites or users with no activity, generate another analysis with Limit Display to set to the number shown as the Inactive Count.