
-
Titel
Using the PostgreSQL Servers dashboard -
Beschreibung
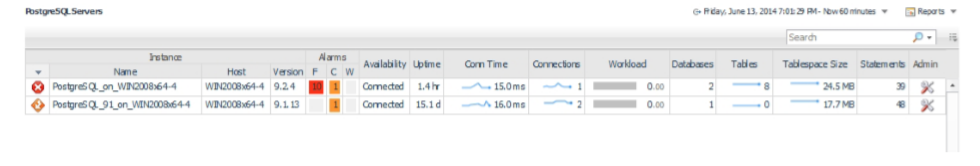
The PostgreSQL Servers dashboard displays a row for each PostgreSQL agent instance deployed. This table gives a brief overview of each server’s health, availability, response time, and size.
-
Lösung
Data
Instance
- Health – Shows the overall health of the deployed instance.
- Name – The name of the PostgreSQL agent. This is the name entered when the PostgreSQL agent instance was created.
- Host – Hostname of the machine where the PostgreSQL server is located.
- Version – The version number of the PostgreSQL server being monitored.
Alarms
- Fatal – Provides a count of the “Fatal” alerts for this agent.
- Critical – Provides a count of the “Critical” alerts for this agent.
- Warning – Provides a count of the “Warning” alerts for this agent.
Other Information
- Availability – Whether the agent is able to connect to the PostgreSQL server.
- Uptime – How long the server has been running for.
- Conn Time – The amount of time needed for the agent to establish a successful JDBC connection to the server.
- Connections – The current number of backends connected to the server.
- Workload – The combined workload of database-level workload metrics, workload is a calculation of time spent reading and writing data file blocks by backends in a sample period, divided by the sample period time. This represents the load on the server and may exceed 1 because of concurrent processing. This is not an estimation of resource usage or availability. Requires track_io_timing to be enabled, available only in v9.2+.
- Databases – The current number of databases contained by the server.
- Tables – The current total number of user tables in the server.
- Tablespace Size – The current size on disk of the server’s combined tablespace files.
- Statements – The number of statements gathered in the last sample. This collection may be limited due to the # of Top Statements property in the Agent Properties or the pg_stat_statements.max setting on the PostgreSQL server.
Actions
The PostgreSQL Servers dashboard is conveniently linked to several pages and also contains popup information to provide a natural workflow while investigating server performance. Several fields in the table have dwell (hovering over the cell value) or drilldown (clicking on the cell value) capability. A list of available interactions with the table is displayed below:
- Health (dwell or drilldown) - Shows a breakdown of child objects in a warning, critical, or fatal state.
- Name (drilldown) – Navigates to the Server Overview dashboard for the selected server.
- Host (drilldown) – Navigates to the Host Monitor page for the selected host. This page will only show data if you are monitoring the OS for this host. For more information on this page, see the related documentation for the infrastructure cartridge.
- Alarms (dwell or drilldown) – Displays a list of alarms in the selected severity level.
- Conn Time (dwell or drilldown) – A popup time plot of the connection time.
- Connections
- Dwell - A popup time plot of connections.
- Drilldown – Navigates to the Current Backends page.
- Workload (dwell or drilldown) – Displays a popup time plot of workload.
- Databases (drilldown) – Navigates to the Databases dashboard.
- Tables
- Dwell - A popup time plot of total tables.
- Drilldown – Navigates to the Tables page.
- Tablespace Size
- Dwell - A popup time plot of the tablespace size.
- Drilldown – Navigates to the Tablespaces page.
- Statements (drilldown) – Navigates to the Statements dashboard.
Admin Actions
If your user account has the PostgreSQL Administrator role and the PostgreSQL user provided to the agent has the appropriate permissions, you can perform administrative actions on the server from the dashboard. Click the icon in the Admin table column to perform one of the following actions:
- Statement Stat Reset – If using the pg_stat_statements module, this action empties the pg_stat_statements view and resets all statement statistics. The extension will then repopulate the view based on new statements. The next sample by the PostgreSQL agent will collect these as normal.