
-
Titel
What do the Cassandra Node Overview, Node Keyspaces, Node Tables, and Node Table dashboards display? -
Beschreibung
What do the Cassandra Node Overview, Node Keyspaces, Node Tables, Node Table dashboards display? -
Lösung
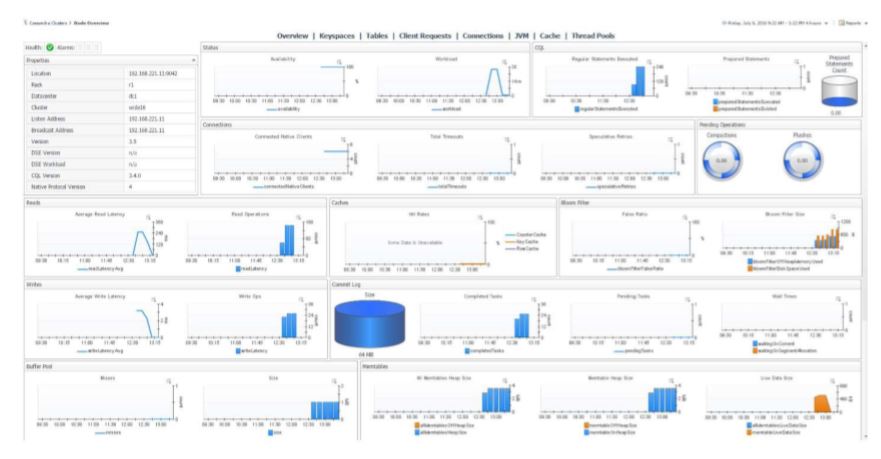
The Node Overview page provides a comprehensive view of the Cassandra Node, with health and alarms and configuration information at the top left and metrics grouped into relevant categories on the rest of the page. Once in the node section of the dashboards, the navigation bar at the top of the page can be used to navigate between different pages containing more information on the selected node. The Node Selector in the action panel on the right can also be used to switch between nodes in the same cluster.
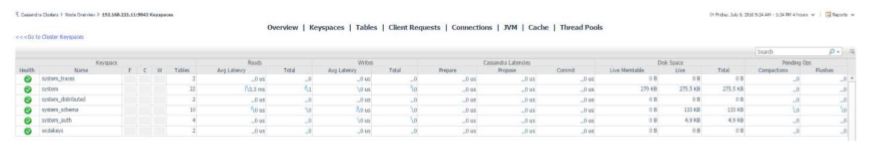
The Node Keyspaces page lists all keyspaces on the selected node, with metric information on reads and writes, latency timing, disk space, and pending operations. Clicking the Keyspace Name or Tables column value will drill down to the Node Tables page, filtering for only tables in that keyspace. The “Go to Cluster Keyspaces” link above the table will link to that page for the same cluster, where you can compare keyspaces across different nodes by selecting a keyspace row.
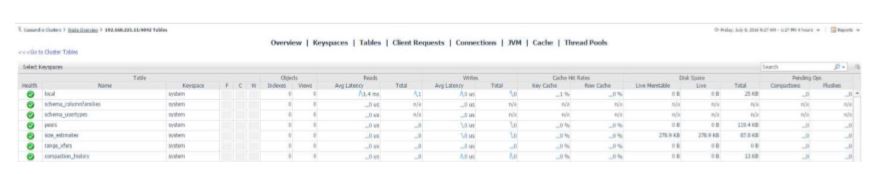
The Node Tables page lists tables on the selected node, aggregating metric information across nodes, with metric information on reads and writes, latency timing, disk space, and pending operations. Clicking the Table Name column value will drill down to the Node Table page for more information on that table. The “Go to Cluster Tables” link above the table will link to that page for the same cluster, where you can compare tables across different nodes by selecting a table row. To filter the list of tables by keyspace, click the Select Keyspaces button at the top left of the table and select one or more keyspaces for which you wish to view tables.
The Node Table page provides a comprehensive view of the table, with configuration information at the top left and metrics grouped into relevant categories on the rest of the page.

-
Weitere Informationen
Note: Two roles, Cassandra User and Cassandra Administrator, are installed with the cartridge. Viewing Cassandra dashboards requires that a user be assigned one of these or have the core Administrator role. The Set Trace Probability function on the Traces Sample dashboard requires the Cassandra Administrator role.