サポートと今すぐチャット
サポートとのチャット

Foglight for VMware 6.0.0 - User Guide

Using Foglight for VMware
Introducing the virtual infrastructure Navigation basics Interacting with Foglight for VMware VMware Performance Agent configuration
Reference
Views
VMware Alarms views VMware Explorer views VMware Modeler views VMware VirtualCenter views VMware Environment views Other views
Rules
Agent Rules Cluster Rules Datacenter Rules Datastore Rules Resource Pool Rules ESX Server Rules VirtualCenter Rules Virtual Machine Rules VMW Stale Data Management Rule Virtual Switch Rules
Appendix: Alarm Messages Appendix: Metrics

Summary (All Clusters) tab

The Summary (All Clusters) tab shows a summary of system resources for all available clusters in a Virtual Center.

2
In the Virtual Infrastructure view, that appears on the navigation panel, select the Clusters node.

This view is made up of the following embedded views:

This tabular view lists the clusters that exist in the Virtual Center.

CPU Used. The current amount of the CPU speed used by the ESX hosts in the cluster.
Hosts. The number of ESX hosts in the cluster.
Key. The color used in the Combined CPU Consumption chart to represent the cluster.
Memory. The current percentage of memory used by all servers in the cluster.
Name. Cluster name.
Resource Pools. The number of resource pools in the cluster.
Status. The status of the cluster, associated with any alarms raised against that cluster. If no alarms are fired, the status appears as Normal. Otherwise, the status is set to the highest alarm severity (Warning, Critical, or Fatal).

Drill down on any cluster entry. The VMware Explorer refreshes, showing the cluster details on the Summary tab.

Shows the combined percentage of the CPU usage for all clusters in the Virtual Center.

Combined CPU Consumption, %. The combined percentage of the CPU utilization used by all ESX hosts in all clusters to execute system code and user programs during the selected time period.

Drill down on:

Combined CPU Consumption %. Displays the Combined CPU Consumption dialog box.

The VMware Explorer’s Virtual Environment view displays a high-level overview of your virtual environment. The view has a tile for each object type: Clusters, Servers, and Virtual Machines. Each tile shows how many of the corresponding object instances there are in your virtual infrastructure, as well as the count of objects of that type in each of the alarm states (Normal, Warning, Critical, Fatal).

Alarm counts. The total counts of alarms associated with the clusters, servers, or virtual machines, broken down by alarm types (Normal, Warning, Critical, Fatal).
Cluster count. The number of clusters in your virtual environment.
Server count. The number of physical servers in your virtual environment.
Virtual Machine count. The number of virtual machines in your environment.

Drill down on:

Cluster. Displays the Clusters Inventory dwell, showing the names and states of all clusters that exist in the Virtual Center.
Datacenter. Displays the Datacenters Inventory dwell, showing the names and states of all datacenters that exist in the Virtual Center.
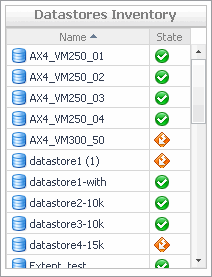
Datastores. Displays the Datastores Inventory dwell, showing the names and states of all datastores that exist in the Virtual Center.
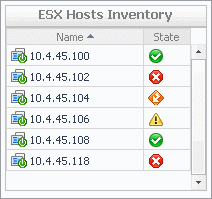
ESX Hosts. Displays the ESX Hosts Inventory dwell, showing the names and states of all ESX hosts that exist in the Virtual Center.
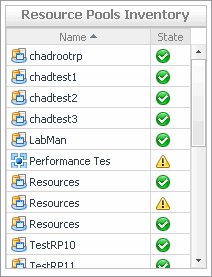
Resource Pools. Displays the Resource Pools Inventory dwell, showing the names and states of all resource pools that exist in the Virtual Center.
Virtual Center. Displays the Virtual Centers Inventory dwell, showing the name and state of the selected Virtual Center.
Virtual Machines. Displays the Virtual Machines Inventory dwell, showing the names and states of all resource pools that exist in the Virtual Center.

Summary (All Datacenters) tab

The Summary (All Datacenters) tab shows a summary of system resources for all datacenters that currently exist in a selected Virtual Center.

2
On the Virtual Infrastructure view, that appears on the navigation panel, select the Datacenters node.

This view is made up of the following embedded views:

Shows the combined percentage of the CPU usage for all ESX hosts in the system.

Combined CPU Consumption %. The combined percentage of the CPU utilization used by all ESX hosts to execute system code and user programs during the selected time period.

Drill down on:

Combined CPU Consumption %. Displays the Combined CPU Consumption dialog box.

This tabular view lists all datacenters that exist in a Virtual Center configuration.

Clusters. The number of clusters associated with the datacenter.
CPU Used. The current amount of the CPU speed that is used by the ESX hosts associated with the datacenter.
Hosts. The number of ESX hosts associated with the datacenter.
Key. The color used in the Combined CPU Consumption chart to represent the datacenter.
Memory. The current percentage of memory that is used by the ESX host.
Name. The datacenter name.
Status. The datacenter status, associated with any alarms raised against it. If no alarms are fired, the status appears as Normal. Otherwise, the status is set to the highest alarm severity (Warning, Critical, or Fatal).
VMs. The number of virtual machines associated with the datacenter.

Drill down on any datacenter entry. The VMware Environment dashboard appears, showing the datacenter details on the Summary tab.

This embedded view shows the same information as the Virtual Environment view appearing on the Summary (All Clusters) tab. See page 143 for complete information.

Summary (All Resource Pools) tab

The Summary (All Resource Pools) tab shows a summary of system resources for all resource pools that currently exist in a selected Virtual Center.

2
On the Virtual Infrastructure view, that appears on the navigation panel, select the Resource Pools node.

This view is made up of the following embedded views:

For complete information about this view, see Resource Pools Relationship Tree view .

This embedded view shows the same information as the Virtual Environment view appearing on the Summary (All Clusters) tab. See page 143 for complete information.

Summary (All Servers) tab

The Summary (All Servers) tab shows a summary of system resources for all ESX hosts that currently exist in a selected Virtual Center.

2
On the Virtual Infrastructure view, that appears on the navigation panel, select the ESX Hosts node.

This view is made up of the following embedded views:

Shows the combined percentage of the CPU usage for all ESX hosts in the system.

Combined CPU Consumption %. The combined percentage of the CPU utilization used by all ESX hosts to execute system code and user programs during the selected time period.

Drill down on:

Combined CPU Consumption %. Displays the Combined CPU Consumption dialog box.

Table 90. ESX hosts

This tabular view lists all ESX hosts that exist in your environment.

ESX host, CPU. The current amount of the CPU speed that is used by the ESX host.
ESX host, Key. The color used in the Combined CPU Consumption chart to represent the ESX host.
ESX host, Memory. The current percentage of memory that is used by the ESX host.
ESX host, NICs. The number of network interface cards used by the ESX host.
ESX host, ESX host Name. ESX host name.
ESX host, Status. The ESX host status, associated with any alarms raised against it. If no alarms are fired, the status appears as Normal. Otherwise, the status is set to the highest alarm severity (Warning, Critical, or Fatal).
ESX host, Version. The version number of the Windows OS running on the ESX host.
Virtual Machines, Configured. The number of virtual machines that exist on the ESX host.
Virtual Machines, Running. The number of virtual machines that are running on the ESX host.

Drill down on any ESX host entry. The VMware Environment dashboard appears, showing the ESX host details on the Summary tab.

This embedded view shows the same information as the Virtual Environment view appearing on the Summary (All Clusters) tab. See page 143 for complete information.

関連ドキュメント

The document was helpful.

評価を選択

I easily found the information I needed.

評価を選択