
Viewing Alerts
The means by which you access Active Alerts depends on which node you select in the Management Console tree.
How to View Alerts:
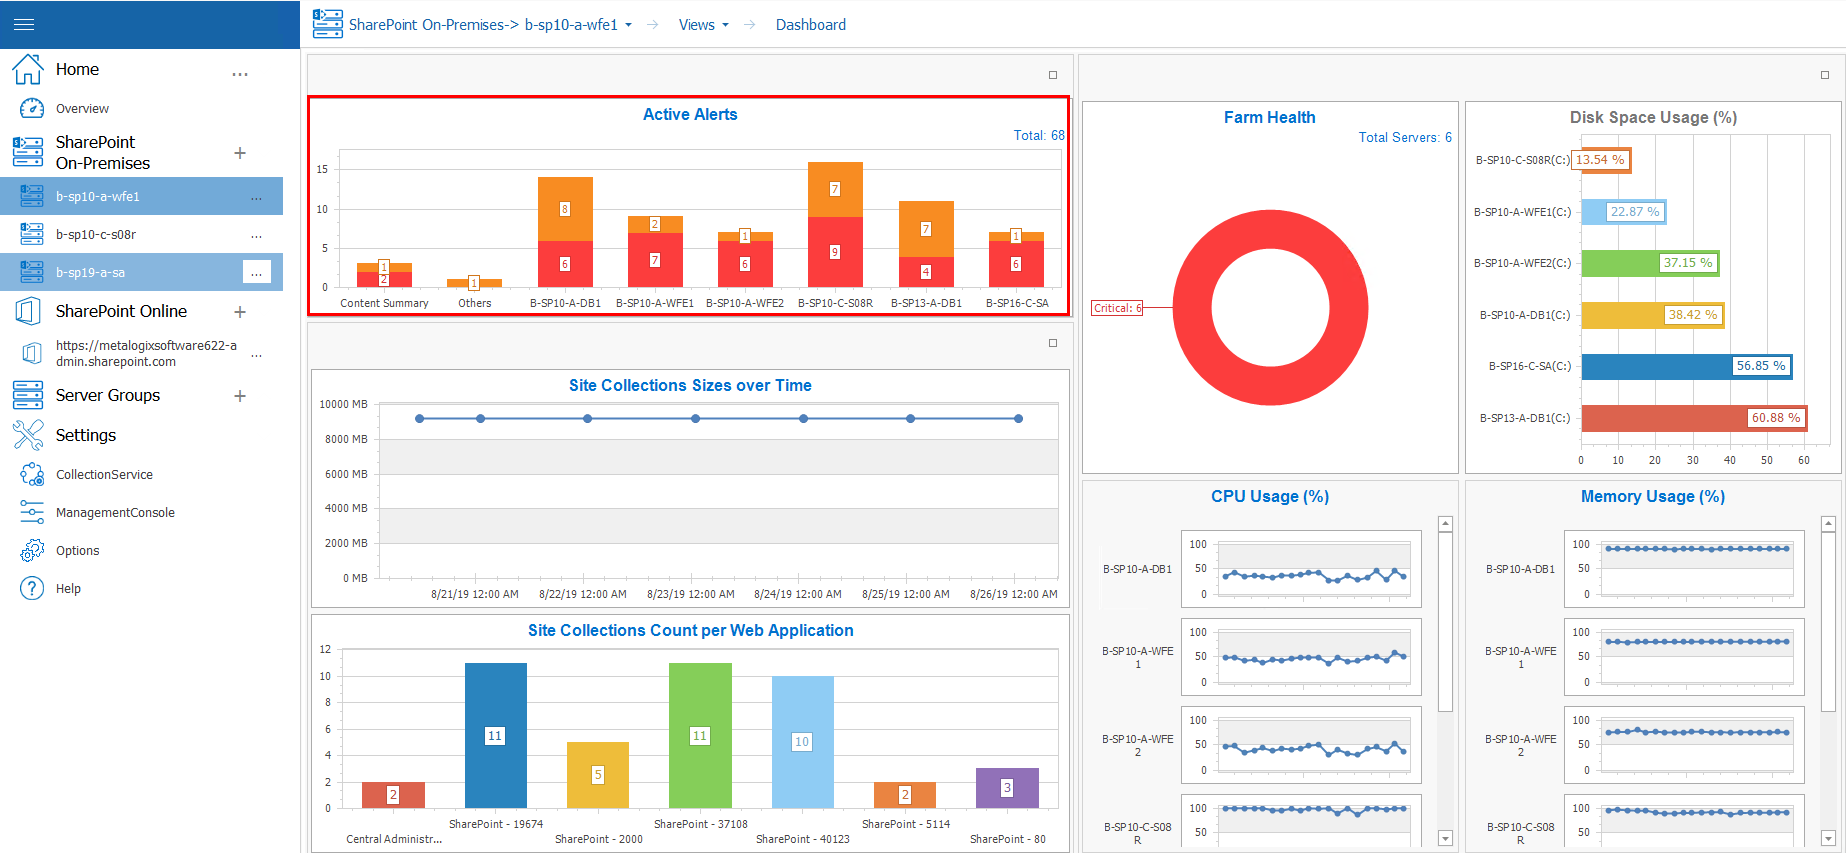
You can view alerts for a monitored farm or Server Group by double-clicking a bar in the Active Alerts graph on the Overview page of a farm or server group.
You can also access alerts by double clicking the farm, and then selecting its name in the top navigation, this opens a sub panel, where you can select Alerts in order to view the alerts.

The following information appears in the list of active alerts:
|
Information |
Description |
|---|---|
|
Alert severity |
An icon indicating the severity level of the alert. |
|
Priority |
The relative importance of the alert.
You can sort this column to group alerts by priority. The default value for Priority is 3, but you can change this value when you edit alert thresholds. |
|
Change |
The way that the alert reached the current level. |
|
Time |
The date and time when the alert was generated. |
|
Alert |
The name of the metric that generated the alert. |
|
Farm / Group |
The farm or Server Group where the selected server resides. |
|
Server |
The server the alert affects. |
|
Instance |
The instance that the alert affects. For some metrics, more than one instance of the source of the metric can exist for a given server or page. |
|
Value |
The actual value of the metric that is the source of the alert. |